- Power BI forums
- Updates
- News & Announcements
- Get Help with Power BI
- Desktop
- Service
- Report Server
- Power Query
- Mobile Apps
- Developer
- DAX Commands and Tips
- Custom Visuals Development Discussion
- Health and Life Sciences
- Power BI Spanish forums
- Translated Spanish Desktop
- Power Platform Integration - Better Together!
- Power Platform Integrations (Read-only)
- Power Platform and Dynamics 365 Integrations (Read-only)
- Training and Consulting
- Instructor Led Training
- Dashboard in a Day for Women, by Women
- Galleries
- Community Connections & How-To Videos
- COVID-19 Data Stories Gallery
- Themes Gallery
- Data Stories Gallery
- R Script Showcase
- Webinars and Video Gallery
- Quick Measures Gallery
- 2021 MSBizAppsSummit Gallery
- 2020 MSBizAppsSummit Gallery
- 2019 MSBizAppsSummit Gallery
- Events
- Ideas
- Custom Visuals Ideas
- Issues
- Issues
- Events
- Upcoming Events
- Community Blog
- Power BI Community Blog
- Custom Visuals Community Blog
- Community Support
- Community Accounts & Registration
- Using the Community
- Community Feedback
Register now to learn Fabric in free live sessions led by the best Microsoft experts. From Apr 16 to May 9, in English and Spanish.
- Power BI forums
- Forums
- Get Help with Power BI
- Desktop
- Re: Build a hierarchy with the Matrix Visual witho...
- Subscribe to RSS Feed
- Mark Topic as New
- Mark Topic as Read
- Float this Topic for Current User
- Bookmark
- Subscribe
- Printer Friendly Page
- Mark as New
- Bookmark
- Subscribe
- Mute
- Subscribe to RSS Feed
- Permalink
- Report Inappropriate Content
Build a hierarchy with the Matrix Visual without auto subtotals
Hello, everybody,
I am trying to build a hierarchy with a matrix visual where the subtotals are not calculated by PowerBI. Instead, the subtotals from the data source are to be used. (The subtotals result form different mathematical relationships that are already mapped in the initial system and are not to be replicated again in PowerBI.)
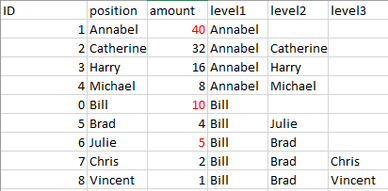
My data source currently looks like this:
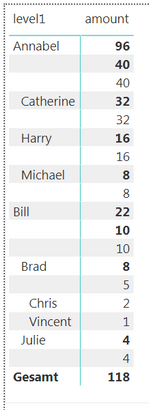
When I create a hierarchy in PowerBI and display it in a matrix visual, I get the following result:
What I actually want (in PowerBI):
Is there a way to display the data like this? If so, how and what settings do I have to make on the Matrix Visual or my data source?
Thanks for your help!
Solved! Go to Solution.
- Mark as New
- Bookmark
- Subscribe
- Mute
- Subscribe to RSS Feed
- Permalink
- Report Inappropriate Content
Hi @Anonymous,
Sorry for the delay.
By my tests with your data, I'm afraid that we may not achieve that in Power BI currently.
If you don't have the subtotal as data source we may achieve that.
Best Regards,
Cherry
If this post helps, then please consider Accept it as the solution to help the other members find it more quickly.
- Mark as New
- Bookmark
- Subscribe
- Mute
- Subscribe to RSS Feed
- Permalink
- Report Inappropriate Content
Hi Dafra,
The output come like this... is it ok for you...
1. You should take columns in "Rows" from Fields Pane.
2. You should change "Stepped Layout" as "OFF" in "Row Headers" from Format Pane.
3. Yous should change "Row Subtotal" as "OFF" in "Subtotals" from Format Pane.
4. Click on "At the Lowest Level of Data" from Visual.
If it proper answer, Pls mark as solution...
Regards
Venu
- Mark as New
- Bookmark
- Subscribe
- Mute
- Subscribe to RSS Feed
- Permalink
- Report Inappropriate Content
Hello @venug20,
thank you for your answer.
I also discovered the solution with the graded layout 🙂
Unfortunately, the subtotals are wrongly aggregated again during the drillup on level 1.
As I already wrote in the answer to @v-piga-msft post, I am actually dealing with accounting data (balance sheet, income statement). A representation without the additional columns would be desirable.
So far I have experimented with new columns and measures, but I haven't found a solution here either. Maybe I don't have the know-how for this...
Thank you for your efforts and best regards,
Frank
- Mark as New
- Bookmark
- Subscribe
- Mute
- Subscribe to RSS Feed
- Permalink
- Report Inappropriate Content
@Anonymous
Pls share your "PBIX", what output is expecting... and Pls share sample output format....
- Mark as New
- Bookmark
- Subscribe
- Mute
- Subscribe to RSS Feed
- Permalink
- Report Inappropriate Content
Hello @venug20,
here is my PBIX file:
https://www.dropbox.com/s/gmfwxxcrrakxop4/pbiforum.pbix?dl=0
In my matrix representation, all blank lines should be removed. The column "amount" contains the wrong values, what I want are the values as shown in the screenshot:
Unfortunately I cannot provide the original file. But the problem can also be seen in the example file.
To solve the problem, you can add columns or measures to my data source (Excel file).
Best regards,
Frank
- Mark as New
- Bookmark
- Subscribe
- Mute
- Subscribe to RSS Feed
- Permalink
- Report Inappropriate Content
@Anonymous
As per my knowledge, data should be shown in three column, where you dont want blank lines.
which has already provided resolution to you, that is final one for your query..
this is time i proivded sample PBIX file with this link
The sample output is like below....
If it is solution for you, pls accept as solution.... it is help to others...
- Mark as New
- Bookmark
- Subscribe
- Mute
- Subscribe to RSS Feed
- Permalink
- Report Inappropriate Content
Here is my data source as a table, I hope you can copy the data now.
ID | position | amount | level1 | level2 | level3 | |
1 | Annabel | 40 | Annabel | |||
2 | Catherine | 32 | Annabel | Catherine | ||
3 | Harry | 16 | Annabel | Harry | ||
4 | Michael | 8 | Annabel | Michael | ||
0 | Bill | 10 | Bill | |||
5 | Brad | 4 | Bill | Julie | ||
6 | Julie | 5 | Bill | Brad | ||
7 | Chris | 2 | Bill | Brad | Chris | |
8 | Vincent | 1 | Bill | Brad | Vincent |
If you still can't copy the data, please tell me how to add a table in my message.
When I hide the subtotals, these rows have no value at all. However, they should contain the values colored red.
Regards
dafra
- Mark as New
- Bookmark
- Subscribe
- Mute
- Subscribe to RSS Feed
- Permalink
- Report Inappropriate Content
Hi @Anonymous,
Have you solved your problem?
If you have solved, please accept the replies making sense as solution to your question so that people who may have the same question can get the solution directly.
Best Regards,
Cherry
If this post helps, then please consider Accept it as the solution to help the other members find it more quickly.
- Mark as New
- Bookmark
- Subscribe
- Mute
- Subscribe to RSS Feed
- Permalink
- Report Inappropriate Content
Hi @Anonymous,
Sorry for the delay.
By my tests with your data, I'm afraid that we may not achieve that in Power BI currently.
If you don't have the subtotal as data source we may achieve that.
Best Regards,
Cherry
If this post helps, then please consider Accept it as the solution to help the other members find it more quickly.
- Mark as New
- Bookmark
- Subscribe
- Mute
- Subscribe to RSS Feed
- Permalink
- Report Inappropriate Content
Hello @v-piga-msft,
Thank you for your feedback.
I also have to apologize for the delay.
Too bad that PowerBI does not offer a solution for this.
A solution with subtotals calculated by PowerBI is unfortunately not possible. In fact, it is a matter of deeply nested accounting data. In order to maintain the professional correctness of the data to be displayed, the subtotals should not be calculated by PowerBI. Instead, the values should be taken from the data source.
Will PowerBI provide a solution to my problem in the near future or is there an interesting alternative to solving my problem?
Thanks for your help!
Best Regards,
Frank
- Mark as New
- Bookmark
- Subscribe
- Mute
- Subscribe to RSS Feed
- Permalink
- Report Inappropriate Content
Hi @Anonymous,
It seems that you failed to upload the image of your data source, please upload it again as table so that I could copy your data source to have a test.
In addition, you could turn off the subtotals under Format if you don't need it.
Best Regards,
Cherry
If this post helps, then please consider Accept it as the solution to help the other members find it more quickly.
Helpful resources

Microsoft Fabric Learn Together
Covering the world! 9:00-10:30 AM Sydney, 4:00-5:30 PM CET (Paris/Berlin), 7:00-8:30 PM Mexico City

Power BI Monthly Update - April 2024
Check out the April 2024 Power BI update to learn about new features.

| User | Count |
|---|---|
| 114 | |
| 105 | |
| 77 | |
| 67 | |
| 63 |
| User | Count |
|---|---|
| 144 | |
| 107 | |
| 105 | |
| 82 | |
| 69 |


