- Power BI forums
- Updates
- News & Announcements
- Get Help with Power BI
- Desktop
- Service
- Report Server
- Power Query
- Mobile Apps
- Developer
- DAX Commands and Tips
- Custom Visuals Development Discussion
- Health and Life Sciences
- Power BI Spanish forums
- Translated Spanish Desktop
- Power Platform Integration - Better Together!
- Power Platform Integrations (Read-only)
- Power Platform and Dynamics 365 Integrations (Read-only)
- Training and Consulting
- Instructor Led Training
- Dashboard in a Day for Women, by Women
- Galleries
- Community Connections & How-To Videos
- COVID-19 Data Stories Gallery
- Themes Gallery
- Data Stories Gallery
- R Script Showcase
- Webinars and Video Gallery
- Quick Measures Gallery
- 2021 MSBizAppsSummit Gallery
- 2020 MSBizAppsSummit Gallery
- 2019 MSBizAppsSummit Gallery
- Events
- Ideas
- Custom Visuals Ideas
- Issues
- Issues
- Events
- Upcoming Events
- Community Blog
- Power BI Community Blog
- Custom Visuals Community Blog
- Community Support
- Community Accounts & Registration
- Using the Community
- Community Feedback
Earn a 50% discount on the DP-600 certification exam by completing the Fabric 30 Days to Learn It challenge.
- Power BI forums
- Forums
- Get Help with Power BI
- Desktop
- pareto calculations
- Subscribe to RSS Feed
- Mark Topic as New
- Mark Topic as Read
- Float this Topic for Current User
- Bookmark
- Subscribe
- Printer Friendly Page
- Mark as New
- Bookmark
- Subscribe
- Mute
- Subscribe to RSS Feed
- Permalink
- Report Inappropriate Content
pareto calculations
Hi all, here i am trying to calculate pareto calculations based on region.
consider if a rank is selected at 50% then i need to calculate the top 50 items sum in the region level and the top 50 items need to be displayed too, if the rank is 90%, then i need to calculate sum for the top 90 items in the region level and the top 90 items need to be displayed too. Rank is dynamic, so how can i achive it in power bi, when the slicer is selected, then according to slicer (rank) selection, i need to calculate top items sum on region levels and those items need to be displayed. Please help me out with this.
Solved! Go to Solution.
- Mark as New
- Bookmark
- Subscribe
- Mute
- Subscribe to RSS Feed
- Permalink
- Report Inappropriate Content
Hi @Anonymous ,
I created some data:
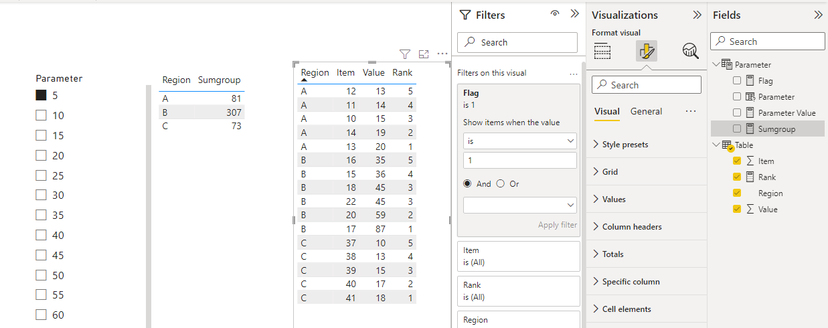
Here are the steps you can follow:
1. Modeling – New parameter -- Set the interval size.
2. Create measure.
Rank =
RANKX(FILTER(ALL('Table'),'Table'[Region]=MAX('Table'[Region])),CALCULATE(SUM('Table'[Value])),,DESC,Dense)
Flag =
var _top=SELECTEDVALUE('Parameter'[Parameter])
return
IF(
[Rank]<=_top,1,0)Rank =
RANKX(FILTER(ALL('Table'),'Table'[Region]=MAX('Table'[Region])),CALCULATE(SUM('Table'[Value])),,DESC,Dense)3. Place [Flag]in Filters, set is=1, apply filter.
4. Result:
Best Regards,
Liu Yang
If this post helps, then please consider Accept it as the solution to help the other members find it more quickly
- Mark as New
- Bookmark
- Subscribe
- Mute
- Subscribe to RSS Feed
- Permalink
- Report Inappropriate Content
@Anonymous , refer if this can help
https://exceleratorbi.com.au/pareto-analysis-in-power-bi/
https://blog.enterprisedna.co/implementing-80-20-logic-in-your-power-bi-analysis/
https://forum.enterprisedna.co/t/testing-the-pareto-principle-80-20-rule-in-power-bi-w-dax/459
Microsoft Power BI Learning Resources, 2023 !!
Learn Power BI - Full Course with Dec-2022, with Window, Index, Offset, 100+ Topics !!
Did I answer your question? Mark my post as a solution! Appreciate your Kudos !! Proud to be a Super User! !!
Helpful resources

Microsoft Fabric Learn Together
Covering the world! 9:00-10:30 AM Sydney, 4:00-5:30 PM CET (Paris/Berlin), 7:00-8:30 PM Mexico City

Power BI Monthly Update - April 2024
Check out the April 2024 Power BI update to learn about new features.

| User | Count |
|---|---|
| 109 | |
| 101 | |
| 84 | |
| 79 | |
| 69 |
| User | Count |
|---|---|
| 120 | |
| 110 | |
| 95 | |
| 82 | |
| 77 |


