Hi @Anonymous,
We don't need Crossjoin with DAX. So the performance could be reasonable. Please download the demo from the attachment. There are three solutions.
1. DAX.
Table =
DISTINCT (
    UNION (
        SELECTCOLUMNS (
            Table1,
            "EAN", [EAN],
            "DESC", [DESC],
            "STORE", [STORE],
            "SEMANA", [SEMANA]
        ),
        SELECTCOLUMNS (
            Table2,
            "EAN", [EAN],
            "DESC", [DESC],
            "STORE", [STORE],
            "SEMANA", [SEMANA]
        )
    )
)
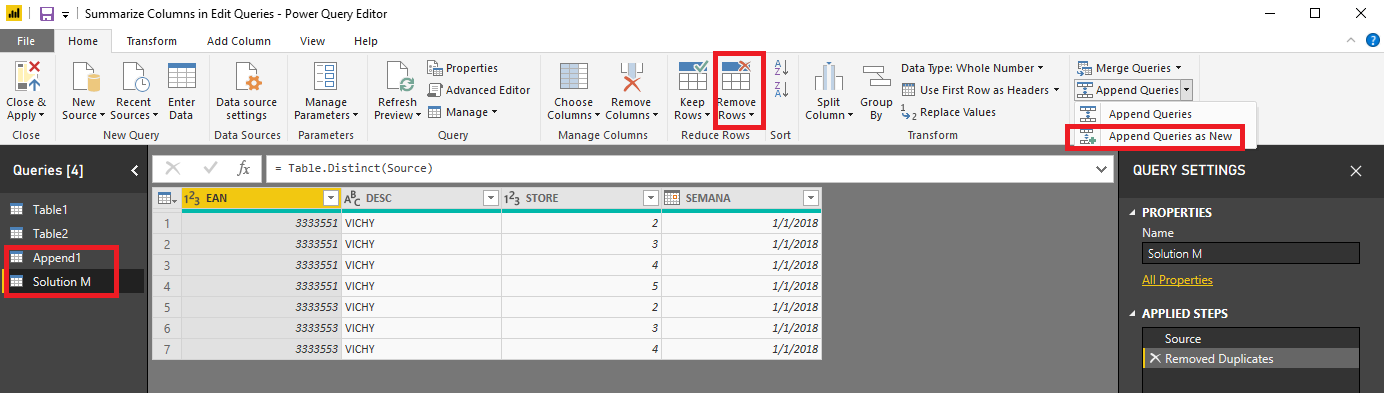
2. Using the function in the menu of the Query Editor.
3. Using M.
let
    Source = Table.Combine({Table.SelectColumns(Table1, {"EAN", "DESC", "STORE", "SEMANA"}), Table.SelectColumns(Table2, {"EAN", "DESC", "STORE", "SEMANA"})}),
    #"Removed Duplicates" = Table.Distinct(Source)
in
    #"Removed Duplicates"
Best Regards,
Dale
Community Support Team _ Dale
If this post helps, then please consider Accept it as the solution to help the other members find it more quickly.


