Hello all,
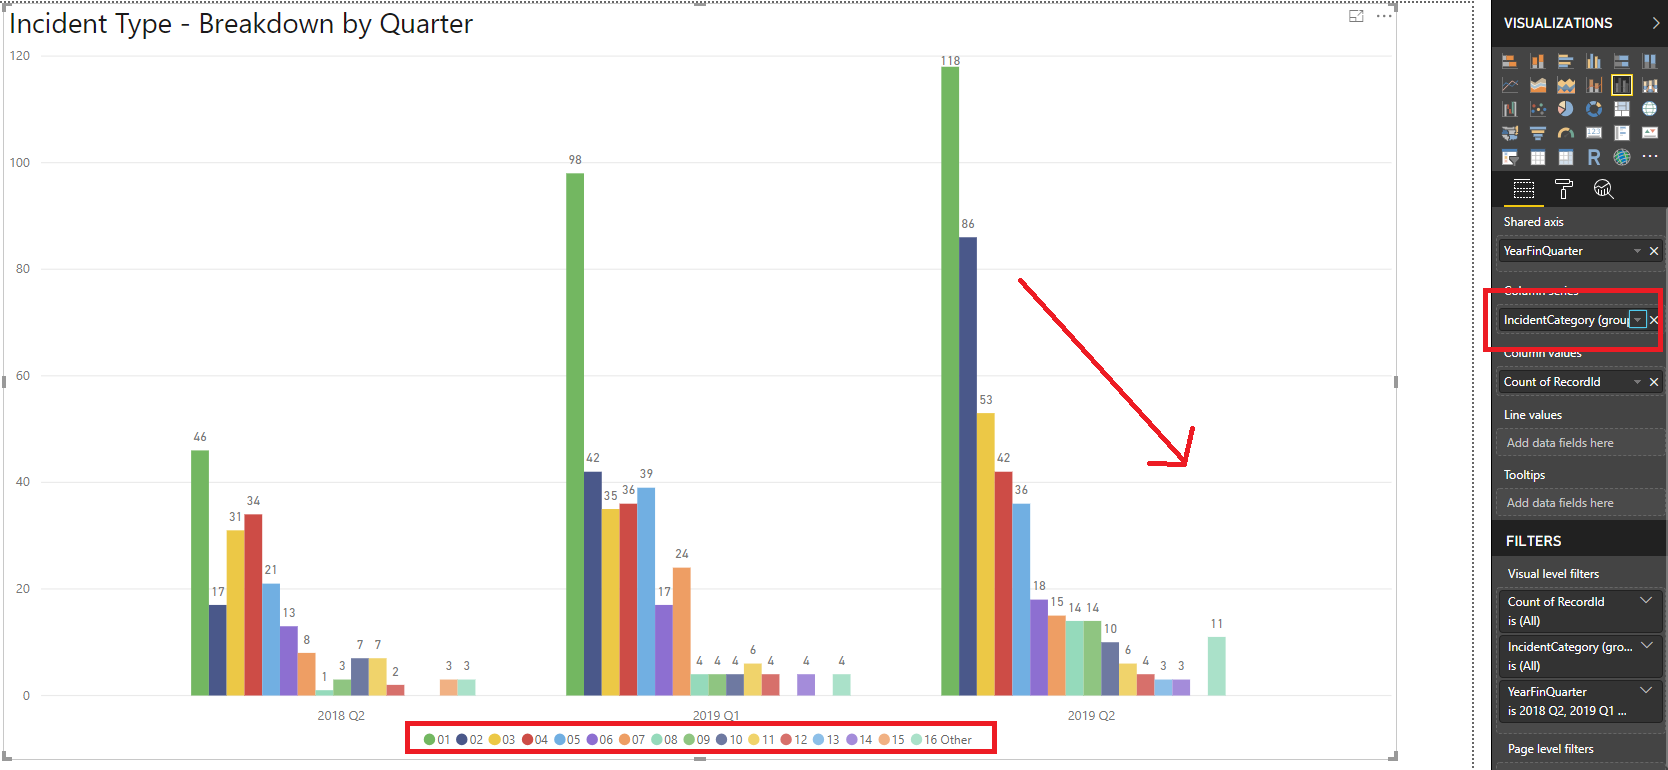
As per the title, I would like to know the best way to sort the values within each cluster of a clustered bar chart. My chart contains a CountOfValues broken up into clusters of Categories and displayed over three time periods. I've been able to achieve sorting of the clusters by putting each Category into a group of its own and naming it with a number that represents the order I'd like them to display. This suits my needs just fine, except the legend now displays the name of the group rather than that of the category which unfortunately doesn't suit my needs.
I'm able to hide the legend and place another chart partially-hidden behind this one for the purpose of displaying its legend, however there has to be a better way...
Thanks in advance for your help