Hi all,
I'm really new to power BI (and BI tools in general) but I would really like to work them into a project I'm currently working on.
The scenario is this, I have an online form that is feeding data back into Power BI - this populates a single table within PBI. Most of the questions on the form are single-choice questions so I have the columns pivoted so that the question is the column title in the table and the single-choices get exported and arrive in Power BI as strings which of course Power-BI can happily count out the box - all is dandy.
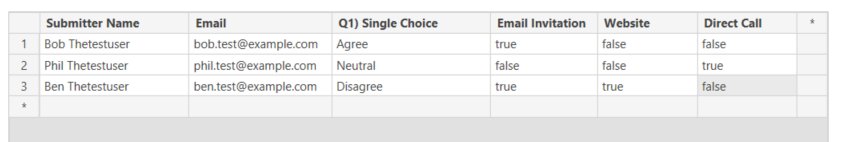
The problem arises where I have multi-choice questions. These get captured in a format unreadable to Power BI (think basic array formatting with a bit more fancy syntax around the side). Without going in to the detail of how I separate everything out, I've reached a point where I can pull a boolean for if that option was chosen or not. As a result of this there is no question = column title in PBI scenario with these, instead each option from the multi-choice has it's own column which for each submitter (each new submitter's information comes in as a new row) has a value of true or false for those columns. (Attached an example using the same layout below - I can't attach the real data/questions).
My goal is to have one clustered column chart that shows for each of the choices the total number (and even more ideally percentage - or even both) of 'true' values, i.e. the %/number of people who ticked that box in the multi-choice (of course as a % of total submitters).
**Notes on the example image:**
On the example table attached, the last 3 columns represent the outcomes of a multi-choice question - e.g:
How did you learn about this event? (Check all the apply)
☑ Email Invitation ☑ Website ☐ Direct Call
As I tried to explain above, the ideal display of this would be individual bars (ideally showing percentages) that have the name of the choice beneath (or at least in a legend) and the coumn height represents %/no of times the answer was chosen in relation to total submitters.
Any help would be greatly appreciated!


