Jumpstart your career with the Fabric Career Hub
Find everything you need to get certified on Fabric—skills challenges, live sessions, exam prep, role guidance, and more.
Get started- Power BI forums
- Updates
- News & Announcements
- Get Help with Power BI
- Desktop
- Service
- Report Server
- Power Query
- Mobile Apps
- Developer
- DAX Commands and Tips
- Custom Visuals Development Discussion
- Health and Life Sciences
- Power BI Spanish forums
- Translated Spanish Desktop
- Power Platform Integration - Better Together!
- Power Platform Integrations (Read-only)
- Power Platform and Dynamics 365 Integrations (Read-only)
- Training and Consulting
- Instructor Led Training
- Dashboard in a Day for Women, by Women
- Galleries
- Community Connections & How-To Videos
- COVID-19 Data Stories Gallery
- Themes Gallery
- Data Stories Gallery
- R Script Showcase
- Webinars and Video Gallery
- Quick Measures Gallery
- 2021 MSBizAppsSummit Gallery
- 2020 MSBizAppsSummit Gallery
- 2019 MSBizAppsSummit Gallery
- Events
- Ideas
- Custom Visuals Ideas
- Issues
- Issues
- Events
- Upcoming Events
- Community Blog
- Power BI Community Blog
- Custom Visuals Community Blog
- Community Support
- Community Accounts & Registration
- Using the Community
- Community Feedback
Grow your Fabric skills and prepare for the DP-600 certification exam by completing the latest Microsoft Fabric challenge.
- Power BI forums
- Forums
- Get Help with Power BI
- Desktop
- Re: Multiple Running Totals to Compare Different Y...
- Subscribe to RSS Feed
- Mark Topic as New
- Mark Topic as Read
- Float this Topic for Current User
- Bookmark
- Subscribe
- Printer Friendly Page
- Mark as New
- Bookmark
- Subscribe
- Mute
- Subscribe to RSS Feed
- Permalink
- Report Inappropriate Content
Multiple Running Totals to Compare Different Years
Hello,
I'm trying to create comparison of 3 years worths of data based on most recent completed month. I created 3 measures [Sales $],[Sales $ LY] and [Sales $ LLY] that calculate Sales Total for current, previous and 2 years ago. Everything is working properly, now I'm trying to create a running total for each of those periods and that is where I'm running into a problem. I created measures [Sales $ RT] that calculates running total based on [Saled $], but I can't figure out how to get running totals for [Sales $ LY] and [Sales $ LLY].
Here is code for all my measures.
-- [Sales $]
MEASURE [Sales $] = CALCULATE ( SUM ( SalesData[SaleLineTotal] ) )


-- [Sales $ RT]
MEASURE [Sales $ RT] =
var MaxMonth = MAX('Dim - Date'[MonthOrdinal])
var Result =
    CALCULATE(
            [Sales $],
            'Dim - Date'[MonthOrdinal] <= MaxMonth,
            REMOVEFILTERS('Dim - Date')
    )
RETURN Result

-- [Sales $ LY]
MEASURE [Sales $ LY] =
VAR MaxMonth = [MaxMonthOrdinal] - 12
VAR Results =
    CALCULATE (
        [Sales $],
        REMOVEFILTERS ( 'Dim - Date' ),
        'Dim - Date'[MonthOrdinal] = MaxMonth
    )
RETURN
    Results

-- [Sales $ LLY]
MEASURE [Sales $ LLY] =
VAR MaxMonth = [MaxMonthOrdinal] - 24
VAR Results =
    CALCULATE (
        [Sales $],
        REMOVEFILTERS ( 'Dim - Date' ),
        'Dim - Date'[MonthOrdinal] = MaxMonth
    )
RETURN
    Results
When I put data in the table I see correct data for [Sales $], [Sales $ LY] and [Sales $ RT]
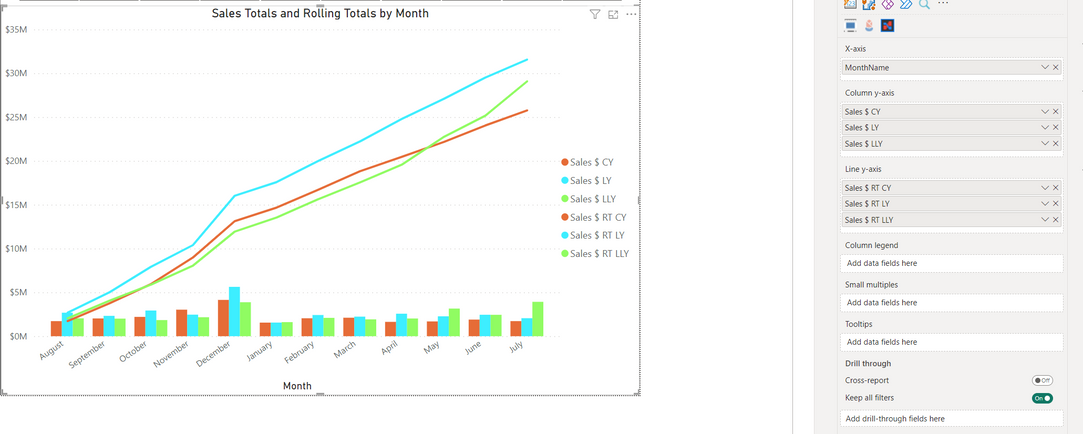
After that I switch to the line chart, what I need chart to show is 3 running totals instead of just 1.
Thanks,
Solved! Go to Solution.
- Mark as New
- Bookmark
- Subscribe
- Mute
- Subscribe to RSS Feed
- Permalink
- Report Inappropriate Content
I ended up solving it myself. I lost the count of how many variations of the DAX I tried until I came up with the following solution.
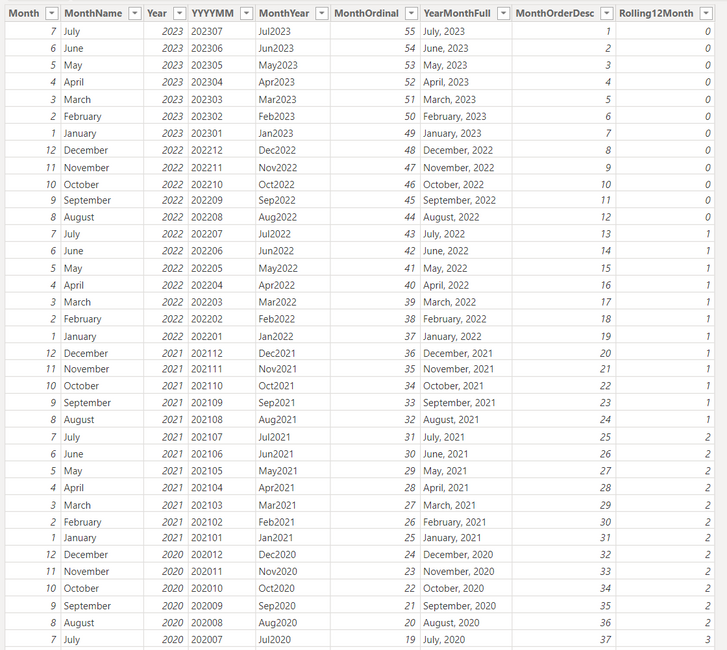
For starters I modified my calendar table to create groups of years. I added column Rolling12Months that defines each year
Next I updated my [Sales $ LY] and [Sales $ LLY] to use Rolling12Month instead of MonthOrdinal,
Finally for Rolling Total Measures all of them are the same except which Sales Total they call
-- Sales Totals
MEASURE [Sales $] = CALCULATE ( SUM ( SalesData[SaleLineTotal] ) )

MEASURE [Sales $ LY] =
VAR RY = [MinRollingYear] + 1
VAR Results =
    CALCULATE (
        [Sales $],
        REMOVEFILTERS ( 'Dim - Date' ),
        'Dim - Date'[Rolling12Month] = RY,
        VALUES ('Dim - Date'[MonthName])
    )
RETURN
    Results

MEASURE [Sales $ LLY] =
VAR RY = [MinRollingYear] + 2
VAR Results =
    CALCULATE (
        [Sales $],
        REMOVEFILTERS ( 'Dim - Date' ),
        'Dim - Date'[Rolling12Month] = RY,
        VALUES ('Dim - Date'[MonthName])
    )
RETURN
    Results

-- Rolling Totals
MEASURE [Sales $ RT] =
var MaxMonth = MAX('Dim - Date'[MonthOrdinal])
var Result =
    CALCULATE(
            [Sales $],
            'Dim - Date'[MonthOrdinal] <= MaxMonth,
            REMOVEFILTERS('Dim - Date'),
            VALUES('Dim - Date'[Rolling12Month])
    )
RETURN Result

MEASURE [Sales $ RT LY] =
var MaxMonth = MAX('Dim - Date'[MonthOrdinal])
var Result =
    CALCULATE(
            [Sales $ LY],
            'Dim - Date'[MonthOrdinal] <= MaxMonth,
            REMOVEFILTERS('Dim - Date'),
            VALUES('Dim - Date'[Rolling12Month])
    )
RETURN Result

MEASURE [Sales $ RT LLY] =
var MaxMonth = MAX('Dim - Date'[MonthOrdinal])
var Result =
    CALCULATE(
            [Sales $ LLY],
            'Dim - Date'[MonthOrdinal] <= MaxMonth,
            REMOVEFILTERS('Dim - Date'),
            VALUES('Dim - Date'[Rolling12Month])
    )
RETURN Result
Fo the final result I finally got by graph that I was looking for.
- Mark as New
- Bookmark
- Subscribe
- Mute
- Subscribe to RSS Feed
- Permalink
- Report Inappropriate Content
-- [Sales $ RT]
MEASURE [Sales $ RT] =
var MaxMonth = MAX('Dim - Date'[MonthOrdinal])
var Result =
CALCULATE(
[Sales $],
'Dim - Date'[MonthOrdinal] <= MaxMonth,
REMOVEFILTERS('Dim - Date')
)
RETURN Result
-- [Sales $ LY RT]
MEASURE [Sales $ LY RT] =
VAR MaxMonth = MAX('Dim - Date'[MonthOrdinal]) - 12
VAR Result =
CALCULATE(
[Sales $ LY],
'Dim - Date'[MonthOrdinal] <= MaxMonth,
REMOVEFILTERS('Dim - Date')
)
RETURN Result
-- [Sales $ LLY RT]
MEASURE [Sales $ LLY RT] =
VAR MaxMonth = MAX('Dim - Date'[MonthOrdinal]) - 24
VAR Result =
CALCULATE(
[Sales $ LLY],
'Dim - Date'[MonthOrdinal] <= MaxMonth,
REMOVEFILTERS('Dim - Date')
)
RETURN Result
Helpful resources
| User | Count |
|---|---|
| 84 | |
| 80 | |
| 72 | |
| 71 | |
| 55 |
| User | Count |
|---|---|
| 108 | |
| 106 | |
| 93 | |
| 85 | |
| 67 |


