- Power BI forums
- Updates
- News & Announcements
- Get Help with Power BI
- Desktop
- Service
- Report Server
- Power Query
- Mobile Apps
- Developer
- DAX Commands and Tips
- Custom Visuals Development Discussion
- Health and Life Sciences
- Power BI Spanish forums
- Translated Spanish Desktop
- Power Platform Integration - Better Together!
- Power Platform Integrations (Read-only)
- Power Platform and Dynamics 365 Integrations (Read-only)
- Training and Consulting
- Instructor Led Training
- Dashboard in a Day for Women, by Women
- Galleries
- Community Connections & How-To Videos
- COVID-19 Data Stories Gallery
- Themes Gallery
- Data Stories Gallery
- R Script Showcase
- Webinars and Video Gallery
- Quick Measures Gallery
- 2021 MSBizAppsSummit Gallery
- 2020 MSBizAppsSummit Gallery
- 2019 MSBizAppsSummit Gallery
- Events
- Ideas
- Custom Visuals Ideas
- Issues
- Issues
- Events
- Upcoming Events
- Community Blog
- Power BI Community Blog
- Custom Visuals Community Blog
- Community Support
- Community Accounts & Registration
- Using the Community
- Community Feedback
Register now to learn Fabric in free live sessions led by the best Microsoft experts. From Apr 16 to May 9, in English and Spanish.
- Power BI forums
- Forums
- Get Help with Power BI
- Desktop
- Re: Months are not ordered when the date is relate...
- Subscribe to RSS Feed
- Mark Topic as New
- Mark Topic as Read
- Float this Topic for Current User
- Bookmark
- Subscribe
- Printer Friendly Page
- Mark as New
- Bookmark
- Subscribe
- Mute
- Subscribe to RSS Feed
- Permalink
- Report Inappropriate Content
Months are not ordered when the date is related to the next year (Jan 2021)
Hello,
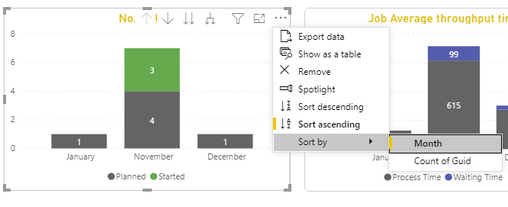
Our charts axis are dates and Everything was ok until these dates started to be in Jan 2021, and now the columns are not in the right order:
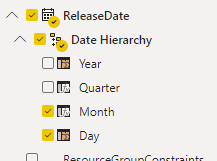
And this is the column I'm using in the axis:
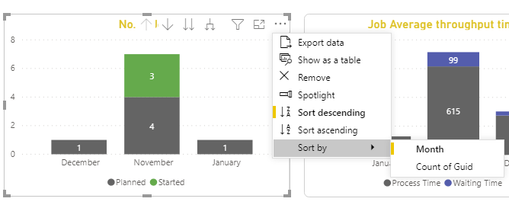
And that's how it looks like when I sort by month (asc/ desc):
When we delete the data of january from the source the months become well ordered, so the issue is about the data of 2021 which is coming before the months of 2020.
Any suggested solution.
Thank you in advance.
Solved! Go to Solution.
- Mark as New
- Bookmark
- Subscribe
- Mute
- Subscribe to RSS Feed
- Permalink
- Report Inappropriate Content
Hi. It doesn't seem to be a problem at all. Check how you are drilling down. The two down arrows will expand next level summarizing all years. That's why January will always be first. You have to use the icon with one arrow that splits in two right next to the two down arrows. Check the gif out (January = enero). The picture has as axis Year and Month Name (without quarter and day)

Hope that helps,
Happy to help!
- Mark as New
- Bookmark
- Subscribe
- Mute
- Subscribe to RSS Feed
- Permalink
- Report Inappropriate Content
Hi. It doesn't seem to be a problem at all. Check how you are drilling down. The two down arrows will expand next level summarizing all years. That's why January will always be first. You have to use the icon with one arrow that splits in two right next to the two down arrows. Check the gif out (January = enero). The picture has as axis Year and Month Name (without quarter and day)

Hope that helps,
Happy to help!
- Mark as New
- Bookmark
- Subscribe
- Mute
- Subscribe to RSS Feed
- Permalink
- Report Inappropriate Content
Hi @ibarrau,
Thank you a lot for your help and your demonstration, you saved me.
I did what you mentioned in your answer, I included the year in the chart axis and right now it looks like this:
Do you think I can also hide the year label from the charts right now?
Thank you again.
- Mark as New
- Bookmark
- Subscribe
- Mute
- Subscribe to RSS Feed
- Permalink
- Report Inappropriate Content
I'm not sure if you can get rid of the year. I wouldn't recommend it because it might be confusing for the final user without it :S
Happy to help 🙂
Happy to help!
Helpful resources

Microsoft Fabric Learn Together
Covering the world! 9:00-10:30 AM Sydney, 4:00-5:30 PM CET (Paris/Berlin), 7:00-8:30 PM Mexico City

Power BI Monthly Update - April 2024
Check out the April 2024 Power BI update to learn about new features.

| User | Count |
|---|---|
| 113 | |
| 103 | |
| 77 | |
| 66 | |
| 63 |
| User | Count |
|---|---|
| 142 | |
| 105 | |
| 102 | |
| 81 | |
| 68 |


