- Power BI forums
- Updates
- News & Announcements
- Get Help with Power BI
- Desktop
- Service
- Report Server
- Power Query
- Mobile Apps
- Developer
- DAX Commands and Tips
- Custom Visuals Development Discussion
- Health and Life Sciences
- Power BI Spanish forums
- Translated Spanish Desktop
- Power Platform Integration - Better Together!
- Power Platform Integrations (Read-only)
- Power Platform and Dynamics 365 Integrations (Read-only)
- Training and Consulting
- Instructor Led Training
- Dashboard in a Day for Women, by Women
- Galleries
- Community Connections & How-To Videos
- COVID-19 Data Stories Gallery
- Themes Gallery
- Data Stories Gallery
- R Script Showcase
- Webinars and Video Gallery
- Quick Measures Gallery
- 2021 MSBizAppsSummit Gallery
- 2020 MSBizAppsSummit Gallery
- 2019 MSBizAppsSummit Gallery
- Events
- Ideas
- Custom Visuals Ideas
- Issues
- Issues
- Events
- Upcoming Events
- Community Blog
- Power BI Community Blog
- Custom Visuals Community Blog
- Community Support
- Community Accounts & Registration
- Using the Community
- Community Feedback
Earn a 50% discount on the DP-600 certification exam by completing the Fabric 30 Days to Learn It challenge.
- Power BI forums
- Forums
- Get Help with Power BI
- Desktop
- Measure based on level of Drill Down
- Subscribe to RSS Feed
- Mark Topic as New
- Mark Topic as Read
- Float this Topic for Current User
- Bookmark
- Subscribe
- Printer Friendly Page
- Mark as New
- Bookmark
- Subscribe
- Mute
- Subscribe to RSS Feed
- Permalink
- Report Inappropriate Content
Measure based on level of Drill Down
Hi Community,
A total NOOB here. I need to get a matrix visualization, with a measure ([% of TOTAL]) that changes the calculation based on what level is being shown.
My table has some [Product Categories], and those product categories have several [Product SubCategories].
For every SubCategory, i have a [VOLUME] value that I need to SUM and then divide on the Total to get the [% Of Total] measure.
But this calculation changes denominator, based on what level of row I'm showing, based on a drill down.
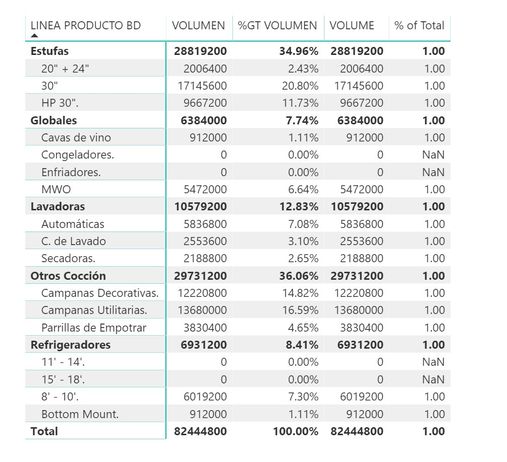
I need to show a table (or matrix) with the following outcome:
How can I accompish this in Power BI? thanks in advance for the help
- Mark as New
- Bookmark
- Subscribe
- Mute
- Subscribe to RSS Feed
- Permalink
- Report Inappropriate Content
Hi,
Volume should be a measure
Volume = SUM(Data[Quantity])
% of Total = IF(HASONEVALUE(Data[SubCategory]),[Volume]/CALCULATE([Volume],ALL(Data[SubCategory])),[Volume]/CALCULATE([Volume],ALL(Data[Category])))
Hope this helps.
Regards,
Ashish Mathur
http://www.ashishmathur.com
https://www.linkedin.com/in/excelenthusiasts/
- Mark as New
- Bookmark
- Subscribe
- Mute
- Subscribe to RSS Feed
- Permalink
- Report Inappropriate Content
HI @Ashish_Mathur,
Thank you for your answer.
I did exactly what you told me in two different scenarios:
1.- When the Values for the measure (Let's keep calling them Data[Quantity] in this example and are the values you see in the second column titled VOLUMEN in the screenshot below) are in the same table as the Dimensions (Data[Category] and Data[SubCategory] which are the values for the first column you can see in the screenshot below titled LINEA PRODUCTOS BD), it worked perfectly.
2.- Having the Values for VOLUME measure in another table (Lets call it FACT[Quantity] for this example), it returns me 1.00 for every row in the column [% of Total]
What am I doing wrong?
- Mark as New
- Bookmark
- Subscribe
- Mute
- Subscribe to RSS Feed
- Permalink
- Report Inappropriate Content
Hi,
There is a missing relationship. To get further help, share the link from where i can download your PBI file.
Regards,
Ashish Mathur
http://www.ashishmathur.com
https://www.linkedin.com/in/excelenthusiasts/
- Mark as New
- Bookmark
- Subscribe
- Mute
- Subscribe to RSS Feed
- Permalink
- Report Inappropriate Content
You can download my pbix file from here: https://www.dropbox.com/s/hripff2ugx7vsuy/_AG_Model.pbix?dl=0
Some things to explains the model. Since the user wants to be able to select two scenarios, based on the same filter options (Let's say [YEAR], [Q], EXERCISE/PERIOD] and some other columns), and produce a third table with the variations on those selected scenarios I had to duplicate the DATA table (kind of a fact table) to be able to filter each and then produce the third one.
Any recommendations are more than welcome.
- Mark as New
- Bookmark
- Subscribe
- Mute
- Subscribe to RSS Feed
- Permalink
- Report Inappropriate Content
Hi,
I am comfortably confused. Just show me one table in that PBI file, point out the incorrect number there and show me the expected result.
Regards,
Ashish Mathur
http://www.ashishmathur.com
https://www.linkedin.com/in/excelenthusiasts/
- Mark as New
- Bookmark
- Subscribe
- Mute
- Subscribe to RSS Feed
- Permalink
- Report Inappropriate Content
Sorry @Ashish_Mathur
I'm confused too... You are telling me that you're looking the correct results?


