- Power BI forums
- Updates
- News & Announcements
- Get Help with Power BI
- Desktop
- Service
- Report Server
- Power Query
- Mobile Apps
- Developer
- DAX Commands and Tips
- Custom Visuals Development Discussion
- Health and Life Sciences
- Power BI Spanish forums
- Translated Spanish Desktop
- Power Platform Integration - Better Together!
- Power Platform Integrations (Read-only)
- Power Platform and Dynamics 365 Integrations (Read-only)
- Training and Consulting
- Instructor Led Training
- Dashboard in a Day for Women, by Women
- Galleries
- Community Connections & How-To Videos
- COVID-19 Data Stories Gallery
- Themes Gallery
- Data Stories Gallery
- R Script Showcase
- Webinars and Video Gallery
- Quick Measures Gallery
- 2021 MSBizAppsSummit Gallery
- 2020 MSBizAppsSummit Gallery
- 2019 MSBizAppsSummit Gallery
- Events
- Ideas
- Custom Visuals Ideas
- Issues
- Issues
- Events
- Upcoming Events
- Community Blog
- Power BI Community Blog
- Custom Visuals Community Blog
- Community Support
- Community Accounts & Registration
- Using the Community
- Community Feedback
Earn a 50% discount on the DP-600 certification exam by completing the Fabric 30 Days to Learn It challenge.
- Power BI forums
- Forums
- Get Help with Power BI
- Desktop
- Re: Is there a way to format tables with multiple ...
- Subscribe to RSS Feed
- Mark Topic as New
- Mark Topic as Read
- Float this Topic for Current User
- Bookmark
- Subscribe
- Printer Friendly Page
- Mark as New
- Bookmark
- Subscribe
- Mute
- Subscribe to RSS Feed
- Permalink
- Report Inappropriate Content
Is there a way to format tables with multiple layered columns?
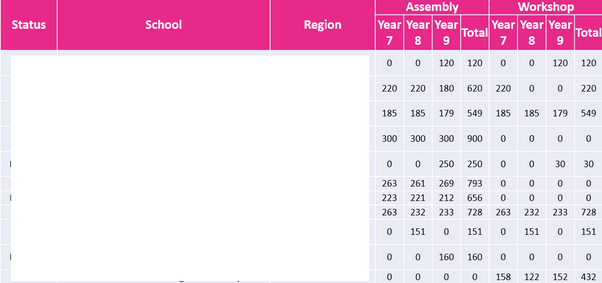
Hi there, I don't think it is possible, even in a matrix table but I thought I'll enquire on here if it is possible to format a table in such a way as this one below (created in excel):
I've blocked out some sensitive data, however, I was wondering if in the same table you could create heirarchal columns like the one's on the right hand side? Assembly / Workshop --> (year groups / total) ?
I've tried to look at a Matrix table and that doesn't have the right format either. Any help would be appreciated.
Solved! Go to Solution.
- Mark as New
- Bookmark
- Subscribe
- Mute
- Subscribe to RSS Feed
- Permalink
- Report Inappropriate Content
Create your data with
Status
School
Region
Assembly
Workshop
Amount
In a matrix visula drag
Row = Status, School, Region
Columns = Assembly, Workshop
Values = Amount
Then use the fork icon in the expander controls to view all the levels.
Please clcik thumbs up and accept as solution button. 😀
- Mark as New
- Bookmark
- Subscribe
- Mute
- Subscribe to RSS Feed
- Permalink
- Report Inappropriate Content
Please post some sample data as a table (not a screen shot) so we can quickly import it and create a solution.
Hide any private data.
- Mark as New
- Bookmark
- Subscribe
- Mute
- Subscribe to RSS Feed
- Permalink
- Report Inappropriate Content
Hi @speedramps is there any way I can send you a sample PBIX file? Cause there's quite a lot of tables.
- Mark as New
- Bookmark
- Subscribe
- Mute
- Subscribe to RSS Feed
- Permalink
- Report Inappropriate Content
You can save a PBIX on Onedrive with view share access and them post the link here.
However, we wont have access to your data sources !
So it is a good idea to use Enter Data to copy and paste demo data from your source data.
You can copy and paste 499 rows at a time which is plenty for a demo.
Remove any private data.
The Enter Data table is then save as part of the PBIX and is shared.
See this example
https://1drv.ms/u/s!AgMTUY3Uvq3bg6R9opB4vehG6yHpxQ?e=TfSJSc
- Mark as New
- Bookmark
- Subscribe
- Mute
- Subscribe to RSS Feed
- Permalink
- Report Inappropriate Content
Create your data with
Status
School
Region
Assembly
Workshop
Amount
In a matrix visula drag
Row = Status, School, Region
Columns = Assembly, Workshop
Values = Amount
Then use the fork icon in the expander controls to view all the levels.
Please clcik thumbs up and accept as solution button. 😀
- Mark as New
- Bookmark
- Subscribe
- Mute
- Subscribe to RSS Feed
- Permalink
- Report Inappropriate Content
Actually @speedramps i've just played about with the fork more and I've managed to make it the way I needed, I just didn't use the drill options on columns! Thank you for your patience and assistance, I've accepted as best answer.
- Mark as New
- Bookmark
- Subscribe
- Mute
- Subscribe to RSS Feed
- Permalink
- Report Inappropriate Content
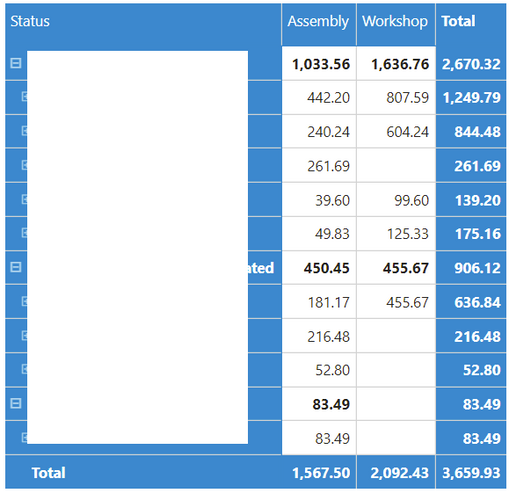
Hi @speedramps thank you for your suggestion. I've tried the Matrix visual and this was the best I could do:
Am I doing this wrong or is this the best I can get with what I want?
Helpful resources
| User | Count |
|---|---|
| 98 | |
| 91 | |
| 84 | |
| 72 | |
| 67 |
| User | Count |
|---|---|
| 114 | |
| 103 | |
| 100 | |
| 72 | |
| 64 |


