- Power BI forums
- Updates
- News & Announcements
- Get Help with Power BI
- Desktop
- Service
- Report Server
- Power Query
- Mobile Apps
- Developer
- DAX Commands and Tips
- Custom Visuals Development Discussion
- Health and Life Sciences
- Power BI Spanish forums
- Translated Spanish Desktop
- Power Platform Integration - Better Together!
- Power Platform Integrations (Read-only)
- Power Platform and Dynamics 365 Integrations (Read-only)
- Training and Consulting
- Instructor Led Training
- Dashboard in a Day for Women, by Women
- Galleries
- Community Connections & How-To Videos
- COVID-19 Data Stories Gallery
- Themes Gallery
- Data Stories Gallery
- R Script Showcase
- Webinars and Video Gallery
- Quick Measures Gallery
- 2021 MSBizAppsSummit Gallery
- 2020 MSBizAppsSummit Gallery
- 2019 MSBizAppsSummit Gallery
- Events
- Ideas
- Custom Visuals Ideas
- Issues
- Issues
- Events
- Upcoming Events
- Community Blog
- Power BI Community Blog
- Custom Visuals Community Blog
- Community Support
- Community Accounts & Registration
- Using the Community
- Community Feedback
Register now to learn Fabric in free live sessions led by the best Microsoft experts. From Apr 16 to May 9, in English and Spanish.
- Power BI forums
- Forums
- Get Help with Power BI
- Desktop
- How to do sequential ranking in Power Bi
- Subscribe to RSS Feed
- Mark Topic as New
- Mark Topic as Read
- Float this Topic for Current User
- Bookmark
- Subscribe
- Printer Friendly Page
- Mark as New
- Bookmark
- Subscribe
- Mute
- Subscribe to RSS Feed
- Permalink
- Report Inappropriate Content
How to do sequential ranking in Power Bi
Hi guys!
Does anyone could give me some advice on these two problems please?
1) I have different rankings for Assets, and I would like to apply them sequentially, like in the following example.
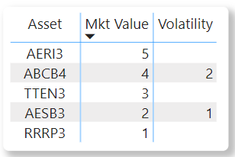
- I have 7 Asset Codes in my example database, and if I apply the Market Value ranking and limit my number of positions to the first 3 Assets (thus Asset Code number 1 is the one with the highest market value and so on), I'd get this:
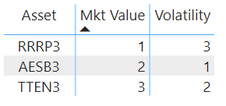
After If I apply the Volatility ranking (the ones with the lowest volatility values get the first positions), the expected result would be this:
Asset Rank Volatility
AESB3 1
TTEN3 2
RRRP3 3
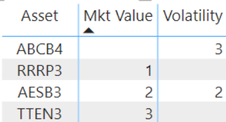
If I simply put the rank volatility together with the first table, it returns me the rank considering more than these 3 Asset Codes, like this:
2) After, I would like to be able to restrain also the quantity of Asset Codes for the subsequent rankings, like this:
2.1) I choose to show the 6 first Asset Codes positions with the Market Value ranking;
2.2) And after I filter the 3 first Asset Codes positions with the Volatility ranking from these 6 prior Asset Codes.
Does anyone have an idea how it could be done?
Here is the example file: https://drive.google.com/file/d/1N_g1fl5zkXibp6vNwy9s_oBifJCiGu0n/view?usp=sharing
Thanks! 🙌
Solved! Go to Solution.
- Mark as New
- Bookmark
- Subscribe
- Mute
- Subscribe to RSS Feed
- Permalink
- Report Inappropriate Content
Ahh I discovered how to deal with the first one! I just applied a filter level on market value, in order for it to be bigger than zero, going from this:
To this:
Now it's only the second problem left 😯
- Mark as New
- Bookmark
- Subscribe
- Mute
- Subscribe to RSS Feed
- Permalink
- Report Inappropriate Content
I discovered how to deal with the second one also 😄
For the second problem we have to create another table 'Top N' (which I named 'Top N 2'), and do the same measure that selects the ranking in function of these slicers ("Top N 2 Volatility"). Now we have two independent slicers, and the selections works in the same table:
- Mark as New
- Bookmark
- Subscribe
- Mute
- Subscribe to RSS Feed
- Permalink
- Report Inappropriate Content
Ahh I discovered how to deal with the first one! I just applied a filter level on market value, in order for it to be bigger than zero, going from this:
To this:
Now it's only the second problem left 😯
Helpful resources

Microsoft Fabric Learn Together
Covering the world! 9:00-10:30 AM Sydney, 4:00-5:30 PM CET (Paris/Berlin), 7:00-8:30 PM Mexico City

Power BI Monthly Update - April 2024
Check out the April 2024 Power BI update to learn about new features.

| User | Count |
|---|---|
| 108 | |
| 105 | |
| 88 | |
| 74 | |
| 66 |
| User | Count |
|---|---|
| 126 | |
| 111 | |
| 100 | |
| 83 | |
| 71 |


