- Power BI forums
- Updates
- News & Announcements
- Get Help with Power BI
- Desktop
- Service
- Report Server
- Power Query
- Mobile Apps
- Developer
- DAX Commands and Tips
- Custom Visuals Development Discussion
- Health and Life Sciences
- Power BI Spanish forums
- Translated Spanish Desktop
- Power Platform Integration - Better Together!
- Power Platform Integrations (Read-only)
- Power Platform and Dynamics 365 Integrations (Read-only)
- Training and Consulting
- Instructor Led Training
- Dashboard in a Day for Women, by Women
- Galleries
- Community Connections & How-To Videos
- COVID-19 Data Stories Gallery
- Themes Gallery
- Data Stories Gallery
- R Script Showcase
- Webinars and Video Gallery
- Quick Measures Gallery
- 2021 MSBizAppsSummit Gallery
- 2020 MSBizAppsSummit Gallery
- 2019 MSBizAppsSummit Gallery
- Events
- Ideas
- Custom Visuals Ideas
- Issues
- Issues
- Events
- Upcoming Events
- Community Blog
- Power BI Community Blog
- Custom Visuals Community Blog
- Community Support
- Community Accounts & Registration
- Using the Community
- Community Feedback
Earn a 50% discount on the DP-600 certification exam by completing the Fabric 30 Days to Learn It challenge.
- Power BI forums
- Forums
- Get Help with Power BI
- Desktop
- How to Make segments
- Subscribe to RSS Feed
- Mark Topic as New
- Mark Topic as Read
- Float this Topic for Current User
- Bookmark
- Subscribe
- Printer Friendly Page
- Mark as New
- Bookmark
- Subscribe
- Mute
- Subscribe to RSS Feed
- Permalink
- Report Inappropriate Content
How to Make segments
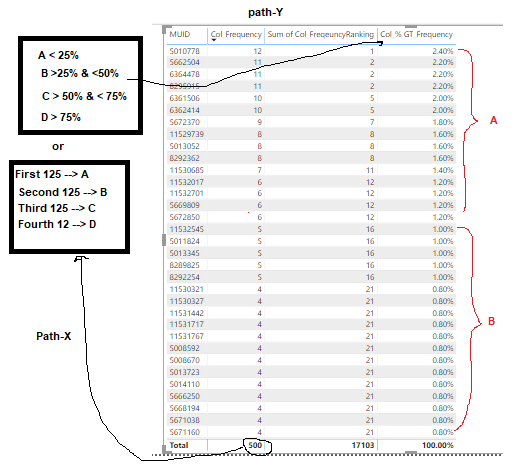
Hi all, I am stuck at some dyanmic segmentation part.
Screenshot :
I am trying mark four segments(A,B,C,D) for above users bit dynamically either via path-X or Path-Y whichever can work for larger dataset.
In above sample data , there are 228 users(MUID) where the each user have some frequency and the sum(frequency) for all users is 500.
Path-X : 500/4 = 125, how can I extract the users or mark the segment-A till the sum reaches the first 125, then seg-B for 125 to 250 ,so on.
Path -Y: Instead of frequency, can we use the %GT of frequency.
Note: columns are sorted by frequency desc.
Sample data is in data.csv here
Solved! Go to Solution.
- Mark as New
- Bookmark
- Subscribe
- Mute
- Subscribe to RSS Feed
- Permalink
- Report Inappropriate Content
Hi, @Anonymous
According to your description, you want to add dyanmic segmentation based on the accumulate sum value, you can try my method:
- Go to power query editor to add an index column:
- Create two measures:
Accumulate sum =

CALCULATE(

    SUM(data[Col_Frequency]),

    FILTER(ALLSELECTED(data),

[Index]<=MAX([Index])))
dyanmic segmentation =

var _sum=SUMX(ALL(data),[Col_Frequency])

var _segment=

SWITCH(

    TRUE(),

    [Cummulative sum]<=0.25*_sum,"A",

    [Cummulative sum]<=0.5*_sum,"B",

    [Cummulative sum]<=0.75*_sum,"C",

    [Cummulative sum]<=_sum,"D",

    BLANK())

return _segment
- Place the [dyanmic segmentation] into the table chart, and you can get what you want, like this:
You can download my test pbix file here
Best Regards,
Community Support Team _Robert Qin
If this post helps, then please consider Accept it as the solution to help the other members find it more quickly.
- Mark as New
- Bookmark
- Subscribe
- Mute
- Subscribe to RSS Feed
- Permalink
- Report Inappropriate Content
@Anonymous , You have to create an independent table with ranges. Using this new table col GT Frequency and values(Table[MUID]) you have to create new measures that use this bucket.
please refer to my video and file(attached after signature) : https://www.youtube.com/watch?v=CuczXPj0N-k
or refer segmentation
https://www.daxpatterns.com/dynamic-segmentation/
https://radacad.com/grouping-and-binning-step-towards-better-data-visualization
Microsoft Power BI Learning Resources, 2023 !!
Learn Power BI - Full Course with Dec-2022, with Window, Index, Offset, 100+ Topics !!
Did I answer your question? Mark my post as a solution! Appreciate your Kudos !! Proud to be a Super User! !!


