- Power BI forums
- Updates
- News & Announcements
- Get Help with Power BI
- Desktop
- Service
- Report Server
- Power Query
- Mobile Apps
- Developer
- DAX Commands and Tips
- Custom Visuals Development Discussion
- Health and Life Sciences
- Power BI Spanish forums
- Translated Spanish Desktop
- Power Platform Integration - Better Together!
- Power Platform Integrations (Read-only)
- Power Platform and Dynamics 365 Integrations (Read-only)
- Training and Consulting
- Instructor Led Training
- Dashboard in a Day for Women, by Women
- Galleries
- Community Connections & How-To Videos
- COVID-19 Data Stories Gallery
- Themes Gallery
- Data Stories Gallery
- R Script Showcase
- Webinars and Video Gallery
- Quick Measures Gallery
- 2021 MSBizAppsSummit Gallery
- 2020 MSBizAppsSummit Gallery
- 2019 MSBizAppsSummit Gallery
- Events
- Ideas
- Custom Visuals Ideas
- Issues
- Issues
- Events
- Upcoming Events
- Community Blog
- Power BI Community Blog
- Custom Visuals Community Blog
- Community Support
- Community Accounts & Registration
- Using the Community
- Community Feedback
Register now to learn Fabric in free live sessions led by the best Microsoft experts. From Apr 16 to May 9, in English and Spanish.
- Power BI forums
- Forums
- Get Help with Power BI
- Desktop
- How can I filter and calculate tasks for 1 or many...
- Subscribe to RSS Feed
- Mark Topic as New
- Mark Topic as Read
- Float this Topic for Current User
- Bookmark
- Subscribe
- Printer Friendly Page
- Mark as New
- Bookmark
- Subscribe
- Mute
- Subscribe to RSS Feed
- Permalink
- Report Inappropriate Content
How can I filter and calculate tasks for 1 or many projects. Get the % calculated and completed
Hello experts.
I have recently started in PowertBI, but I am spending a lot of time researching and learning every day.
At this moment I need help, because I have not advanced for a long time, because I want to be able to see the %estimated and actual% percentage of a task in a line graph.
I would like to have only the end date (for week) in my graph, I based it on a method that I saw on YouTube at the month level.
When I filter in PowerQuery by only 1 project I get the result I want, but I have problems when I have all the projects and tasks.
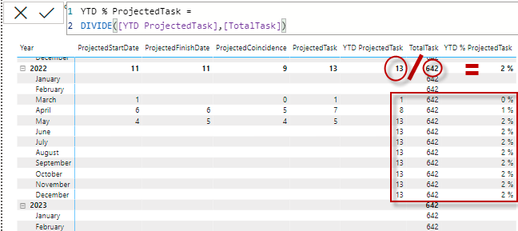
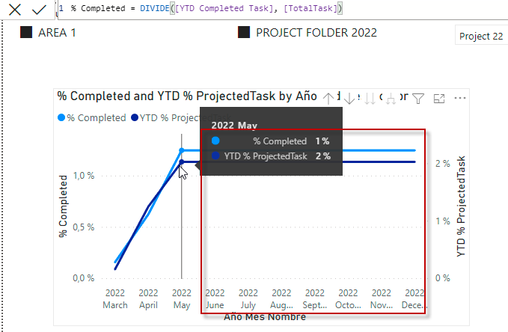
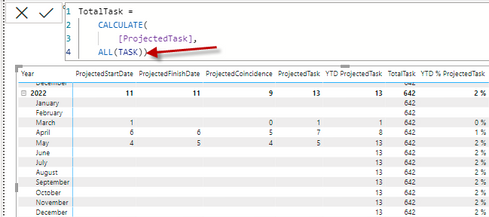
Here I have bad calculation for the %projected and also real %completed, over 1=%100:
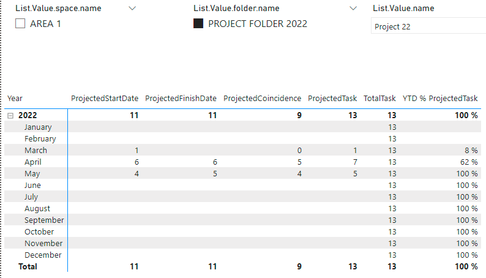
When I filter in powerquery by 1 project, the calculation works
%Percent OK for 1 project, but i would like to get this result with all the projects and then filter from the slice for a specific project
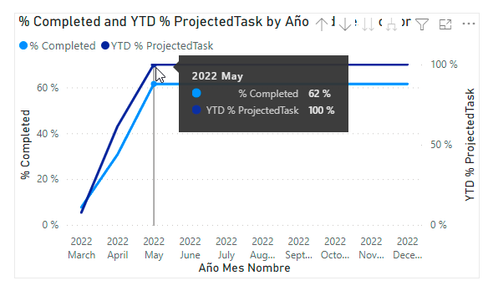
OK line chart for 1 project
In DAX I don't know how to filter and then perform the calculation
I attach the data and PBIX
Thanks!
Solved! Go to Solution.
- Mark as New
- Bookmark
- Subscribe
- Mute
- Subscribe to RSS Feed
- Permalink
- Report Inappropriate Content
I solved my problem, I never saw it because I didn't study hard enough.
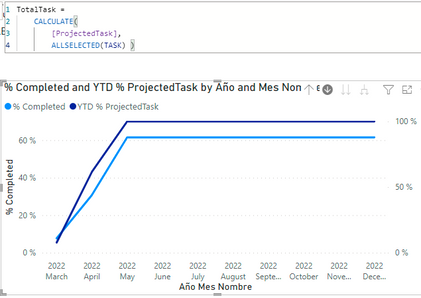
with ALLSELECTED I was able to bring the total value of the field that I needed at the time of filtering.
I would only have to adjust my graph or calculation so that the end date month does not continue drawing.
do not continue drawing after the last due date.
Helpful resources

Microsoft Fabric Learn Together
Covering the world! 9:00-10:30 AM Sydney, 4:00-5:30 PM CET (Paris/Berlin), 7:00-8:30 PM Mexico City

Power BI Monthly Update - April 2024
Check out the April 2024 Power BI update to learn about new features.

| User | Count |
|---|---|
| 100 | |
| 100 | |
| 76 | |
| 68 | |
| 61 |
| User | Count |
|---|---|
| 142 | |
| 106 | |
| 103 | |
| 85 | |
| 70 |
