- Power BI forums
- Updates
- News & Announcements
- Get Help with Power BI
- Desktop
- Service
- Report Server
- Power Query
- Mobile Apps
- Developer
- DAX Commands and Tips
- Custom Visuals Development Discussion
- Health and Life Sciences
- Power BI Spanish forums
- Translated Spanish Desktop
- Power Platform Integration - Better Together!
- Power Platform Integrations (Read-only)
- Power Platform and Dynamics 365 Integrations (Read-only)
- Training and Consulting
- Instructor Led Training
- Dashboard in a Day for Women, by Women
- Galleries
- Community Connections & How-To Videos
- COVID-19 Data Stories Gallery
- Themes Gallery
- Data Stories Gallery
- R Script Showcase
- Webinars and Video Gallery
- Quick Measures Gallery
- 2021 MSBizAppsSummit Gallery
- 2020 MSBizAppsSummit Gallery
- 2019 MSBizAppsSummit Gallery
- Events
- Ideas
- Custom Visuals Ideas
- Issues
- Issues
- Events
- Upcoming Events
- Community Blog
- Power BI Community Blog
- Custom Visuals Community Blog
- Community Support
- Community Accounts & Registration
- Using the Community
- Community Feedback
Earn a 50% discount on the DP-600 certification exam by completing the Fabric 30 Days to Learn It challenge.
- Power BI forums
- Forums
- Get Help with Power BI
- Desktop
- How can I filter and calculate tasks for 1 or many...
- Subscribe to RSS Feed
- Mark Topic as New
- Mark Topic as Read
- Float this Topic for Current User
- Bookmark
- Subscribe
- Printer Friendly Page
- Mark as New
- Bookmark
- Subscribe
- Mute
- Subscribe to RSS Feed
- Permalink
- Report Inappropriate Content
How can I filter and calculate tasks for 1 or many projects. Get the % calculated and completed
Hello experts.
I have recently started in PowertBI, but I am spending a lot of time researching and learning every day.
At this moment I need help, because I have not advanced for a long time, because I want to be able to see the %estimated and actual% percentage of a task in a line graph.
I would like to have only the end date (for week) in my graph, I based it on a method that I saw on YouTube at the month level.
When I filter in PowerQuery by only 1 project I get the result I want, but I have problems when I have all the projects and tasks.
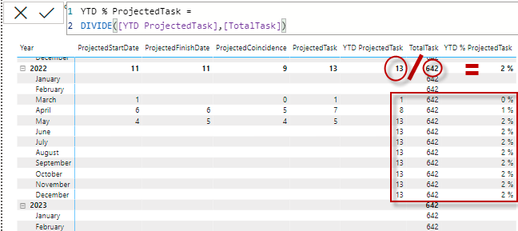
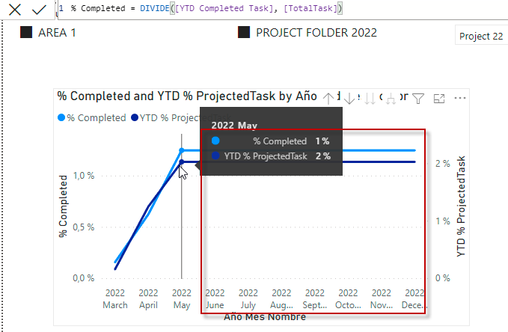
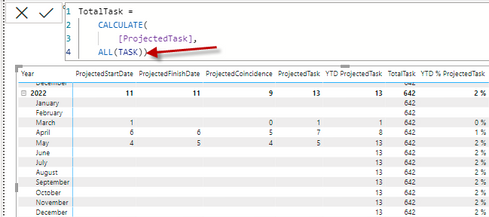
Here I have bad calculation for the %projected and also real %completed, over 1=%100:
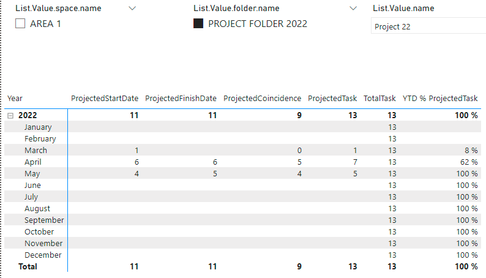
When I filter in powerquery by 1 project, the calculation works
%Percent OK for 1 project, but i would like to get this result with all the projects and then filter from the slice for a specific project
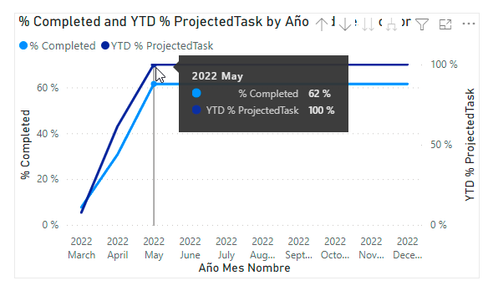
OK line chart for 1 project
In DAX I don't know how to filter and then perform the calculation
I attach the data and PBIX
Thanks!
Solved! Go to Solution.
- Mark as New
- Bookmark
- Subscribe
- Mute
- Subscribe to RSS Feed
- Permalink
- Report Inappropriate Content
I solved my problem, I never saw it because I didn't study hard enough.
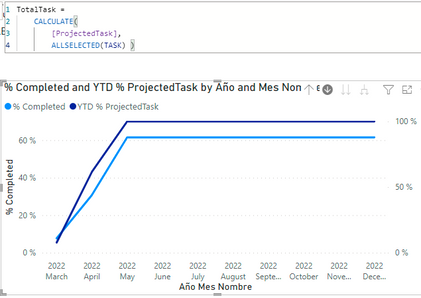
with ALLSELECTED I was able to bring the total value of the field that I needed at the time of filtering.
I would only have to adjust my graph or calculation so that the end date month does not continue drawing.
do not continue drawing after the last due date.
Helpful resources
| User | Count |
|---|---|
| 98 | |
| 91 | |
| 84 | |
| 72 | |
| 67 |
| User | Count |
|---|---|
| 114 | |
| 103 | |
| 100 | |
| 72 | |
| 64 |
