- Power BI forums
- Updates
- News & Announcements
- Get Help with Power BI
- Desktop
- Service
- Report Server
- Power Query
- Mobile Apps
- Developer
- DAX Commands and Tips
- Custom Visuals Development Discussion
- Health and Life Sciences
- Power BI Spanish forums
- Translated Spanish Desktop
- Power Platform Integration - Better Together!
- Power Platform Integrations (Read-only)
- Power Platform and Dynamics 365 Integrations (Read-only)
- Training and Consulting
- Instructor Led Training
- Dashboard in a Day for Women, by Women
- Galleries
- Community Connections & How-To Videos
- COVID-19 Data Stories Gallery
- Themes Gallery
- Data Stories Gallery
- R Script Showcase
- Webinars and Video Gallery
- Quick Measures Gallery
- 2021 MSBizAppsSummit Gallery
- 2020 MSBizAppsSummit Gallery
- 2019 MSBizAppsSummit Gallery
- Events
- Ideas
- Custom Visuals Ideas
- Issues
- Issues
- Events
- Upcoming Events
- Community Blog
- Power BI Community Blog
- Custom Visuals Community Blog
- Community Support
- Community Accounts & Registration
- Using the Community
- Community Feedback
Register now to learn Fabric in free live sessions led by the best Microsoft experts. From Apr 16 to May 9, in English and Spanish.
- Power BI forums
- Forums
- Get Help with Power BI
- Desktop
- Re: Help with Running Totals...with some twists
- Subscribe to RSS Feed
- Mark Topic as New
- Mark Topic as Read
- Float this Topic for Current User
- Bookmark
- Subscribe
- Printer Friendly Page
- Mark as New
- Bookmark
- Subscribe
- Mute
- Subscribe to RSS Feed
- Permalink
- Report Inappropriate Content
Help with Running Totals...with some twists
First post here so go easy on me 🙂 I know there are a number of running total questions, but I've been unable to figure out my issue after reading through some of those.
I have a data set from multiple systems with various temperatures, pressures, date/time stamp, and an index column for each of the systems I created based off the date/time stamp. I'd attach a file if I could figure that out as well 😕. I can do most of what I'm wanting using calculated columns, but I'd like to make the threshold values come from slice selections. I came to realize calculated columns won't support that...and trying to create the measures seems to be above my current ability level.
What I am attempting to do is the following...
1. Compare a temperature reading - lets say cooling temp - to two threshold values, i.e. red = 215, yellow = 206. This determines if a fault has occurred. To determine the severity, temps above the red should equate to 3, below red but above yellow equates to 1, below yellow equates to 0 (or no fault occurred).
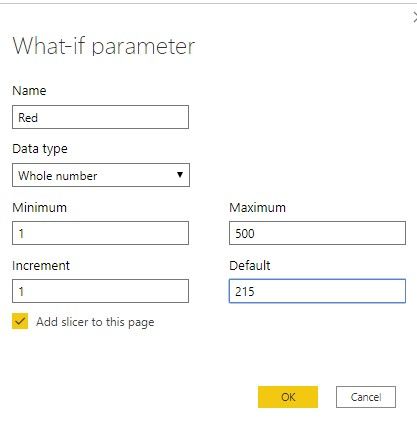
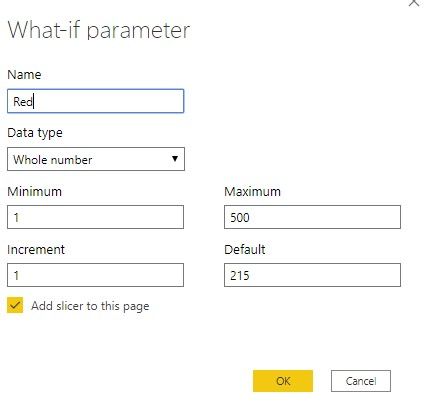
2. I created a parameter table for the red and yellow thresholds. The red and yellow thresholds are what I would like to come from a slicer selection.
3. I created a calculated table which added a column in DAX Studio falled 'Faults' containing the 0, 1, and 3's from the first step. Mainly this was for my own visualization purposes, but I think this is the direction it needs to go...?
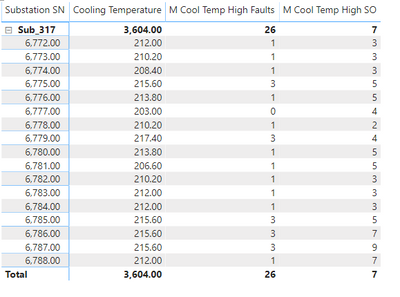
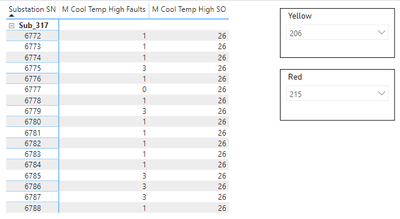
4. Using this column, I'd like to create a running total for each index value summing the 'Faults' column for the current index value along with the prior two index values. See screen shot below. The summary value for index value 6,775 is the sum of Faults value for 6775, 6774, and 6773 (1 + 1 + 3 = 5). I'm guessing that I'd need to add a column to the calculated table from #3..?
Solved! Go to Solution.
- Mark as New
- Bookmark
- Subscribe
- Mute
- Subscribe to RSS Feed
- Permalink
- Report Inappropriate Content
Hi @DK_16 ,
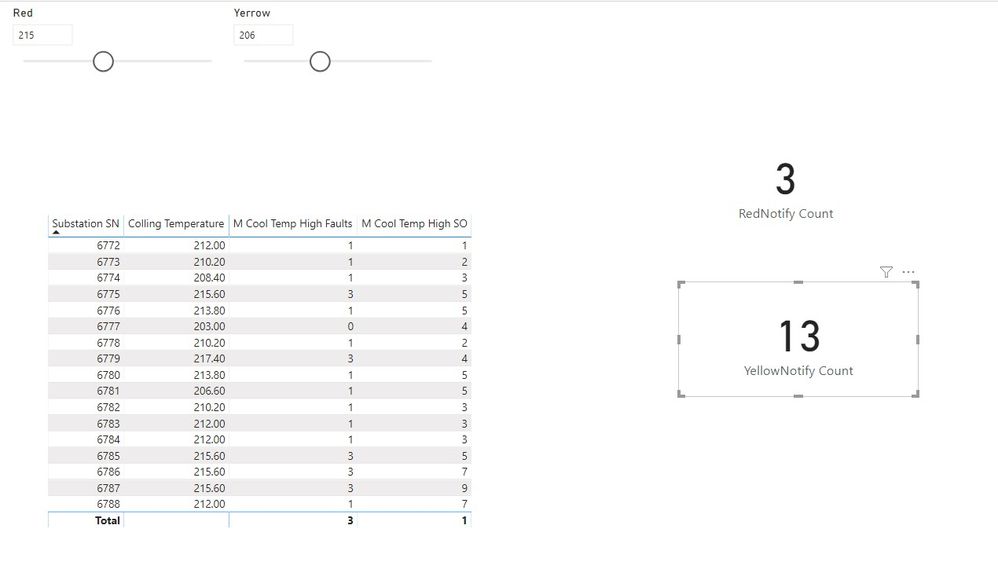
We can create four measures to meet your requirement after create two what-if parameter:
M Cool Temp High Faults = IF(SUM('Table'[Colling Temperature]) < [Yerrow Value], 0,IF(SUM('Table'[Colling Temperature]) <[Red Value],1,3))
M Cool Temp High SO = SUMX(TOPN(3,FILTER(ALLSELECTED('Table'),'Table'[Substation SN] <= MIN('Table'[Substation SN])),[Substation SN],DESC),[M Cool Temp High Faults])
RedNotify Count = COUNTROWS(FILTER(SUMMARIZE('Table','Table'[Substation SN],"M",[M Cool Temp High SO]),[M] >= 6))
YellowNotify Count = COUNTROWS(FILTER(SUMMARIZE('Table','Table'[Substation SN],"M",[M Cool Temp High SO]),[M] >= 2 && [M] <6))
Best regards,
If this post helps, then please consider Accept it as the solution to help the other members find it more quickly.
- Mark as New
- Bookmark
- Subscribe
- Mute
- Subscribe to RSS Feed
- Permalink
- Report Inappropriate Content
@v-lid-msft , I believe I figured out where our difference comes from. I have a substation sn column that represents each system (Sub_317, Sub 329, etc). Each system has it's own index column based on the event timestamp for each data point (the 6772-6788 values). It looks like you may have been using the index as the substation sn value. I created a unique id column from merging the substation sn and index columns. I used that value in the SO measure and everything seems to work as I would like. Thank you again for your help!
M Cool Temp High SO =
SUMX(
    TOPN( 3,
        FILTER( ALLSELECTED(SampleData),
            SampleData[SN_Index] <= MIN(SampleData[SN_Index])),
        [SN_Index],DESC),
    [M Cool Temp High Faults])
- Mark as New
- Bookmark
- Subscribe
- Mute
- Subscribe to RSS Feed
- Permalink
- Report Inappropriate Content
Not sure what happened to the rest of my post, but here it is....
Here is a screenshot of what I'm looking to generate:
I'd like to count the number of times the running total is 6 or higher, then again the number of times its >=2 and <6. Greater than 6 generates a red level notification, between 2 and 6 generates a yellow notification. So basically, if at least two cooling temp values are greater than the red threshold in three consecutive data points, a red noficication is generated. If at least twice the temp value is between the red and yellow threshold values, a yellow level notifcaiton is generated. What I'm really trying to get down to is how many of each notifications are generated.
- Mark as New
- Bookmark
- Subscribe
- Mute
- Subscribe to RSS Feed
- Permalink
- Report Inappropriate Content
Hi @DK_16 ,
We can create four measures to meet your requirement after create two what-if parameter:
M Cool Temp High Faults = IF(SUM('Table'[Colling Temperature]) < [Yerrow Value], 0,IF(SUM('Table'[Colling Temperature]) <[Red Value],1,3))
M Cool Temp High SO = SUMX(TOPN(3,FILTER(ALLSELECTED('Table'),'Table'[Substation SN] <= MIN('Table'[Substation SN])),[Substation SN],DESC),[M Cool Temp High Faults])
RedNotify Count = COUNTROWS(FILTER(SUMMARIZE('Table','Table'[Substation SN],"M",[M Cool Temp High SO]),[M] >= 6))
YellowNotify Count = COUNTROWS(FILTER(SUMMARIZE('Table','Table'[Substation SN],"M",[M Cool Temp High SO]),[M] >= 2 && [M] <6))
Best regards,
If this post helps, then please consider Accept it as the solution to help the other members find it more quickly.
- Mark as New
- Bookmark
- Subscribe
- Mute
- Subscribe to RSS Feed
- Permalink
- Report Inappropriate Content
@v-lid-msft , appreciate your help!
What you have in your screenshot is what I'm after. I created the measures and what if parameters that you have. When I put the measures in a matrix, the SO measure shows the summed Fault measure total for each row instead of the sum of the 3 data points.
The measures I created:
M Cool Temp High Faults =
    IF(
        SUM(SampleData[Cooling Temperature]) < [Yellow Value], 0,
            IF( SUM(SampleData[Cooling Temperature]) > [Red Value], 3, 1))
M Cool Temp High SO =
SUMX(
    TOPN( 3,
        FILTER( ALLSELECTED(SampleData),
            SampleData[Substation SN] <= MIN(SampleData[Substation SN])),
        [Substation SN],DESC),
[M Cool Temp High Faults])- Mark as New
- Bookmark
- Subscribe
- Mute
- Subscribe to RSS Feed
- Permalink
- Report Inappropriate Content
@v-lid-msft , I believe I figured out where our difference comes from. I have a substation sn column that represents each system (Sub_317, Sub 329, etc). Each system has it's own index column based on the event timestamp for each data point (the 6772-6788 values). It looks like you may have been using the index as the substation sn value. I created a unique id column from merging the substation sn and index columns. I used that value in the SO measure and everything seems to work as I would like. Thank you again for your help!
M Cool Temp High SO =
SUMX(
    TOPN( 3,
        FILTER( ALLSELECTED(SampleData),
            SampleData[SN_Index] <= MIN(SampleData[SN_Index])),
        [SN_Index],DESC),
    [M Cool Temp High Faults])
- Mark as New
- Bookmark
- Subscribe
- Mute
- Subscribe to RSS Feed
- Permalink
- Report Inappropriate Content
@v-lid-msft, the measures work; however, when I apply them to my full data set (~900k rows), it shuts down for not enough memory. Is there a more memory friendly alternative or am I out of luck because of the nature of the computation?
- Mark as New
- Bookmark
- Subscribe
- Mute
- Subscribe to RSS Feed
- Permalink
- Report Inappropriate Content
Hi @DK_16 ,
If the SN_Index column always increase by 1, we can try to use the following measure to meet your requirement:
M Cool Temp High SO =
VAR i =
    MIN ( SampleData[SN_Index] )
RETURN
    CALCULATE (
        [M Cool Temp High Faults],
        FILTER ( ALLSELECTED ( SampleData ), SampleData[SN_Index] = i )
    )
        + CALCULATE (
            [M Cool Temp High Faults],
            FILTER ( ALLSELECTED ( SampleData ), SampleData[SN_Index] = i - 1 )
        )
        + CALCULATE (
            [M Cool Temp High Faults],
            FILTER ( ALLSELECTED ( SampleData ), SampleData[SN_Index] = i - 2 )
        )
Best regards,
If this post helps, then please consider Accept it as the solution to help the other members find it more quickly.
- Mark as New
- Bookmark
- Subscribe
- Mute
- Subscribe to RSS Feed
- Permalink
- Report Inappropriate Content
@v-lid-msft , again thank you for your help. Its much appreciated.
The new measure you posted works well, especially in terms of performance, but has one issue.
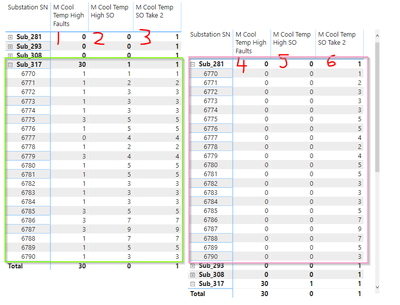
Columns 1-5 in the screenshot below are what is expected. The issue is that for each of the different Substation SN's (which are the different systems/machines that the data comes from) it is using the index number for all Sub SN's and returning the sum of those. Column 3 is accurate for Sub317, but for Sub281 column 6 should be all 0's based on the 0's in column 4. Instead, it has the same values from Sub317. The same occurs for Sub293 and 308.
- Mark as New
- Bookmark
- Subscribe
- Mute
- Subscribe to RSS Feed
- Permalink
- Report Inappropriate Content
Hi @DK_16 ,
We try to consider the Subtation SN column into code, please try to use the following code:
M Cool Temp High SO =
VAR i =
    MIN ( SampleData[SN_Index] )
VAR SN =
    SELECTEDVALUE ( SampleData[Subtation SN] )
RETURN
    CALCULATE (
        [M Cool Temp High Faults],
        FILTER (
            ALLSELECTED ( SampleData ),
            SampleData[SN_Index] = i
                && SampleData[Subtation SN] = SN
        )
    )
        + CALCULATE (
            [M Cool Temp High Faults],
            FILTER (
                ALLSELECTED ( SampleData ),
                SampleData[SN_Index] = i - 1
                    && SampleData[Subtation SN] = SN
            )
        )
        + CALCULATE (
            [M Cool Temp High Faults],
            FILTER (
                ALLSELECTED ( SampleData ),
                SampleData[SN_Index] = i - 2
                    && SampleData[Subtation SN] = SN
            )
        )
Best regards,
If this post helps, then please consider Accept it as the solution to help the other members find it more quickly.
Helpful resources

Microsoft Fabric Learn Together
Covering the world! 9:00-10:30 AM Sydney, 4:00-5:30 PM CET (Paris/Berlin), 7:00-8:30 PM Mexico City

Power BI Monthly Update - April 2024
Check out the April 2024 Power BI update to learn about new features.

| User | Count |
|---|---|
| 97 | |
| 95 | |
| 80 | |
| 77 | |
| 66 |
| User | Count |
|---|---|
| 130 | |
| 106 | |
| 105 | |
| 86 | |
| 72 |
