- Power BI forums
- Updates
- News & Announcements
- Get Help with Power BI
- Desktop
- Service
- Report Server
- Power Query
- Mobile Apps
- Developer
- DAX Commands and Tips
- Custom Visuals Development Discussion
- Health and Life Sciences
- Power BI Spanish forums
- Translated Spanish Desktop
- Power Platform Integration - Better Together!
- Power Platform Integrations (Read-only)
- Power Platform and Dynamics 365 Integrations (Read-only)
- Training and Consulting
- Instructor Led Training
- Dashboard in a Day for Women, by Women
- Galleries
- Community Connections & How-To Videos
- COVID-19 Data Stories Gallery
- Themes Gallery
- Data Stories Gallery
- R Script Showcase
- Webinars and Video Gallery
- Quick Measures Gallery
- 2021 MSBizAppsSummit Gallery
- 2020 MSBizAppsSummit Gallery
- 2019 MSBizAppsSummit Gallery
- Events
- Ideas
- Custom Visuals Ideas
- Issues
- Issues
- Events
- Upcoming Events
- Community Blog
- Power BI Community Blog
- Custom Visuals Community Blog
- Community Support
- Community Accounts & Registration
- Using the Community
- Community Feedback
Register now to learn Fabric in free live sessions led by the best Microsoft experts. From Apr 16 to May 9, in English and Spanish.
- Power BI forums
- Forums
- Get Help with Power BI
- Desktop
- Re: Force-directed nodes
- Subscribe to RSS Feed
- Mark Topic as New
- Mark Topic as Read
- Float this Topic for Current User
- Bookmark
- Subscribe
- Printer Friendly Page
- Mark as New
- Bookmark
- Subscribe
- Mute
- Subscribe to RSS Feed
- Permalink
- Report Inappropriate Content
Force-directed nodes
Hello everyone, is there was way to add additional layers in the force-directed nodes visual? For example I'm try to show relationships between various fruits; apples, oranges, melons. Apples have different varieties and colors, same as oranges and melons. My current node will only show a central fruit node to apples, oranges, and melons but won't let me get to the varieties under each. Is there another visualization I could be using instead?
- Mark as New
- Bookmark
- Subscribe
- Mute
- Subscribe to RSS Feed
- Permalink
- Report Inappropriate Content
Below table shows the raw data and right side is Force-directed graph.

So the graph shows me all three layers. Is this what you have asked for..?
- Mark as New
- Bookmark
- Subscribe
- Mute
- Subscribe to RSS Feed
- Permalink
- Report Inappropriate Content
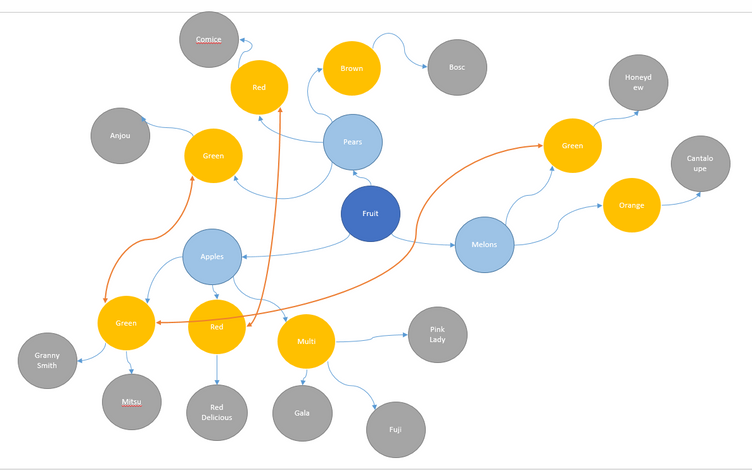
This a visualization I'm trying to create in PowerBI, right now its in PowerPoint. The data starts off at a high level then continues to get more granular, in this example "Fruit" is the highest level, then it goes further into "Type" (Apples, Melons, Pears) -> "Color" (Green, Red, Brown, Orange, Multi) -> "Varieties" (Anjou, Granny Smith, Bosc). As the data drills down, these are the different "nodes" that I'd like to show.
From there I also want to show the links between each node, in this case by the dark orange bi-directional arrows. Apples and pears are connected by the colors red and green, also apples and melons are connected by the color green.
- Mark as New
- Bookmark
- Subscribe
- Mute
- Subscribe to RSS Feed
- Permalink
- Report Inappropriate Content
I tried to play around but couldn't find something which can be shown as your PPT diagram.
Does your data has all text type or any numeric fields..?
Hope someone helps you in this.
- Mark as New
- Bookmark
- Subscribe
- Mute
- Subscribe to RSS Feed
- Permalink
- Report Inappropriate Content
Thanks for taking a shot at it, my actual data is all text. Maybe the force-directed node visualization isn't the right one? I've searched the library but none of the visuals I looked at had additional layers.
- Mark as New
- Bookmark
- Subscribe
- Mute
- Subscribe to RSS Feed
- Permalink
- Report Inappropriate Content
Hi @nlui,
I'm not so clear for your requirement, can you please share some detail contents?
If you only want to shows single item, you can try to use category column and detail information column to create table visual, and switch the detail column to first/last mode.
Regards,
Xiaoxin Sheng
If this post helps, please consider accept as solution to help other members find it more quickly.
- Mark as New
- Bookmark
- Subscribe
- Mute
- Subscribe to RSS Feed
- Permalink
- Report Inappropriate Content
Hi @v-shex-msft, Is there way for the nodes to expand to lower hierarchical levels? Say the first node is "Fruit" then that has three nodes that connect to it, (1) apples (2) bananas (3) melons. Then from the "apples" node three other nodes connect to it (1) fuji (2) granny smith (3) gala. Same goes for bananas and melons. Right now I can only create a nodes that show a connection to fruit-> gala, or apples->gala.
Helpful resources

Microsoft Fabric Learn Together
Covering the world! 9:00-10:30 AM Sydney, 4:00-5:30 PM CET (Paris/Berlin), 7:00-8:30 PM Mexico City

Power BI Monthly Update - April 2024
Check out the April 2024 Power BI update to learn about new features.

| User | Count |
|---|---|
| 96 | |
| 95 | |
| 82 | |
| 71 | |
| 64 |
| User | Count |
|---|---|
| 116 | |
| 106 | |
| 94 | |
| 79 | |
| 72 |


