- Power BI forums
- Updates
- News & Announcements
- Get Help with Power BI
- Desktop
- Service
- Report Server
- Power Query
- Mobile Apps
- Developer
- DAX Commands and Tips
- Custom Visuals Development Discussion
- Health and Life Sciences
- Power BI Spanish forums
- Translated Spanish Desktop
- Power Platform Integration - Better Together!
- Power Platform Integrations (Read-only)
- Power Platform and Dynamics 365 Integrations (Read-only)
- Training and Consulting
- Instructor Led Training
- Dashboard in a Day for Women, by Women
- Galleries
- Community Connections & How-To Videos
- COVID-19 Data Stories Gallery
- Themes Gallery
- Data Stories Gallery
- R Script Showcase
- Webinars and Video Gallery
- Quick Measures Gallery
- 2021 MSBizAppsSummit Gallery
- 2020 MSBizAppsSummit Gallery
- 2019 MSBizAppsSummit Gallery
- Events
- Ideas
- Custom Visuals Ideas
- Issues
- Issues
- Events
- Upcoming Events
- Community Blog
- Power BI Community Blog
- Custom Visuals Community Blog
- Community Support
- Community Accounts & Registration
- Using the Community
- Community Feedback
Earn a 50% discount on the DP-600 certification exam by completing the Fabric 30 Days to Learn It challenge.
- Power BI forums
- Forums
- Get Help with Power BI
- Desktop
- Filter line chart without changing data
- Subscribe to RSS Feed
- Mark Topic as New
- Mark Topic as Read
- Float this Topic for Current User
- Bookmark
- Subscribe
- Printer Friendly Page
- Mark as New
- Bookmark
- Subscribe
- Mute
- Subscribe to RSS Feed
- Permalink
- Report Inappropriate Content
Filter line chart without changing data
I have made a line chart to show active users over time. The values stems from a measure which is summing up the number of registrations minus the number of cancellations:
The 'Active users' measure is simply adding the number of regristrations and subtracting the number of cancellations. And the values i use in my line chart is, as the name implies, a running total of that number.
My line chart is working and showing data on a monthly basis. However, I want to only show data for 6 months back. A simple filter on the chart will change the values. I need a way to filter the X axis without changing data.
Solved! Go to Solution.
- Mark as New
- Bookmark
- Subscribe
- Mute
- Subscribe to RSS Feed
- Permalink
- Report Inappropriate Content
Hi @wingsted93 ,
In your measure, replace ALLSELECTED with ALL in that case and check if that works.
Thanks,
Pragati
- Mark as New
- Bookmark
- Subscribe
- Mute
- Subscribe to RSS Feed
- Permalink
- Report Inappropriate Content
Hi @wingsted93 ,
Click on your line chart and got to visual level filters and apply filter on the column that is used on the x-axis.
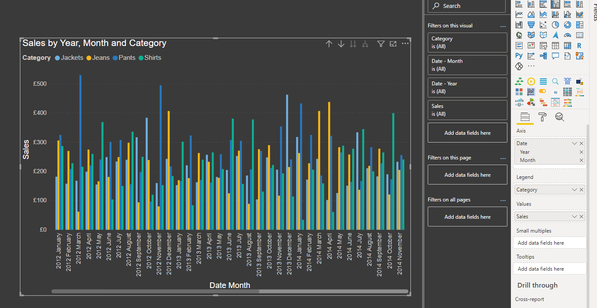
Consider the following visual where I have got SALES by MONTH-YEAR:
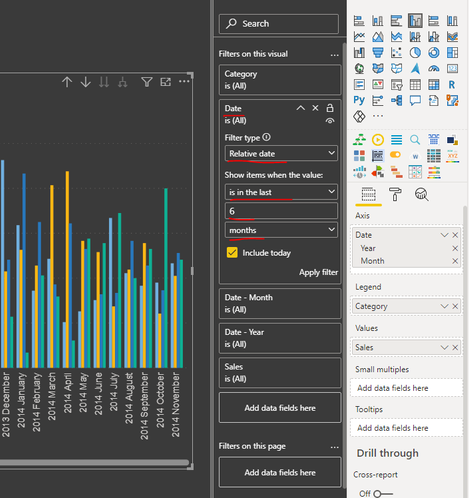
Now suppose if I just want data to be shown for last 6 months, then apply visual level filter on Date column using Relative Filtering option:
Thanks,
Pragati
- Mark as New
- Bookmark
- Subscribe
- Mute
- Subscribe to RSS Feed
- Permalink
- Report Inappropriate Content
Hi @Pragati11 ,
I have aready tried that, but the values are only true if the calculations are made on the entire dataset, and when i filter the way you propose, i get wrong values on the line chart, as it calculates the difference in user registrations vs user cancellations. I need a way to filter without the measure "knowing" about it.
- Mark as New
- Bookmark
- Subscribe
- Mute
- Subscribe to RSS Feed
- Permalink
- Report Inappropriate Content
Hi @wingsted93 ,
In your measure, replace ALLSELECTED with ALL in that case and check if that works.
Thanks,
Pragati
Helpful resources
| User | Count |
|---|---|
| 103 | |
| 90 | |
| 78 | |
| 72 | |
| 68 |
| User | Count |
|---|---|
| 108 | |
| 96 | |
| 95 | |
| 74 | |
| 71 |


