- Power BI forums
- Updates
- News & Announcements
- Get Help with Power BI
- Desktop
- Service
- Report Server
- Power Query
- Mobile Apps
- Developer
- DAX Commands and Tips
- Custom Visuals Development Discussion
- Health and Life Sciences
- Power BI Spanish forums
- Translated Spanish Desktop
- Power Platform Integration - Better Together!
- Power Platform Integrations (Read-only)
- Power Platform and Dynamics 365 Integrations (Read-only)
- Training and Consulting
- Instructor Led Training
- Dashboard in a Day for Women, by Women
- Galleries
- Community Connections & How-To Videos
- COVID-19 Data Stories Gallery
- Themes Gallery
- Data Stories Gallery
- R Script Showcase
- Webinars and Video Gallery
- Quick Measures Gallery
- 2021 MSBizAppsSummit Gallery
- 2020 MSBizAppsSummit Gallery
- 2019 MSBizAppsSummit Gallery
- Events
- Ideas
- Custom Visuals Ideas
- Issues
- Issues
- Events
- Upcoming Events
- Community Blog
- Power BI Community Blog
- Custom Visuals Community Blog
- Community Support
- Community Accounts & Registration
- Using the Community
- Community Feedback
Register now to learn Fabric in free live sessions led by the best Microsoft experts. From Apr 16 to May 9, in English and Spanish.
- Power BI forums
- Forums
- Get Help with Power BI
- Desktop
- Dynamic MTD/YTD selector
- Subscribe to RSS Feed
- Mark Topic as New
- Mark Topic as Read
- Float this Topic for Current User
- Bookmark
- Subscribe
- Printer Friendly Page
- Mark as New
- Bookmark
- Subscribe
- Mute
- Subscribe to RSS Feed
- Permalink
- Report Inappropriate Content
Dynamic MTD/YTD selector
Dear Power BI Community,
I believe I have an interesting problem for you, or at least the one that I couldn't find a solution for in a several days so hope you could point me in the right direction.
For a test project, let's say we have prices of cryptocurrencies from 1JUL2021 to 1JUL2022 and want to build a report showcasing cumulative returns over different periods in time.
I am trying to create a time intelligence logic consisting of two pieces:
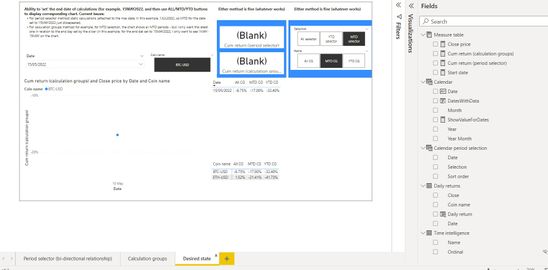
- a user selects a date which serves as the end date to the time intelligence calculations (for example, 15MAY2022);
- then the user uses buttons to switch between the calculation periods (for example, MTD/YTD/ALL) to update relevant charts and tables. For example, for 15MAY2022 and MTD button chosen, the charts and tables would cumulative returns for the range of dates 1MAY2022-15MAY2022.
What I tried so far:
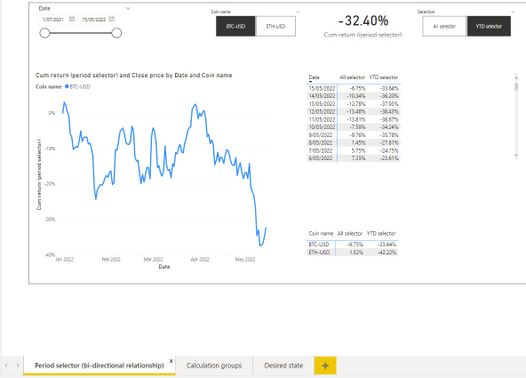
Option 1: use 'calendar period selection' table and bidirectional relationship (https://www.youtube.com/watch?v=AdLDYohLeJc)
Issues:
- the calculations are 'static' - anchored to the latest date only (1JUL2022). So, if I change the end date to 15MAY2022, the MTD button just disappears. Not sure how to solve this problem as looks like it would require slicers to update the 'Calendar period selection' table which doesn't seem possible;
- the calculations contained in the table seem incorrect (the are not the same as in the chart on on the card). Probably due the specifics of bidirectional relationships?
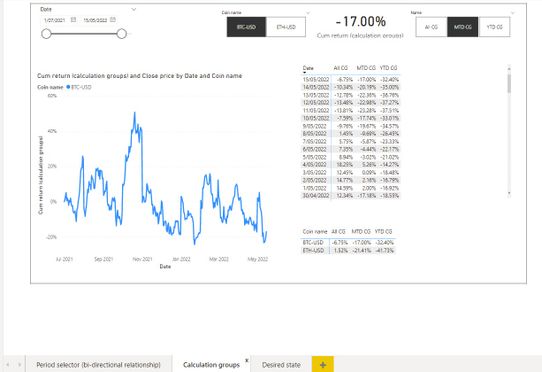
Option 2: use calculation groups.
Issues:
- calculations are correct, but I want to show only the latest (determined by the end date set before) period on the chart, not all. For example, for setting end date to 15MAY2022 and switch to MTD (YTD), I want to show the range 1MAY2022-15MAY2022 (1JAN2022-15MAY2022), not all the dates;
- The first data point is not 0 but the daily return for that day which doesn't look ideal from aesthetic point (but not crucial problem);
- This method might be slower than using Option 1 (but not sure).
From what I saw, Option 2 seems closer to what I want - I just need to figure out how to filter out earlier dates on the chart based on the button selected (in my example with MTD selection, it would be filtering out the dates before 1MAY2022). And starting from 0 would be nice, but not crucial.
Link to the .pbix file and the data: https://drive.google.com/drive/folders/1piTjcI3EIIK9iHVnA_JEhTjqMJ9h6IGd?usp=sharing
But maybe there is an Option 3, or I missed something? Keen to hear your ideas.
Thank you for your time, Martin


Solved! Go to Solution.
- Mark as New
- Bookmark
- Subscribe
- Mute
- Subscribe to RSS Feed
- Permalink
- Report Inappropriate Content
Thank you for your help and time @v-zhangti ,
This is an interesting way to approach this, I might give it a try. I think I got it working for me through a mix of solutions (posted it here: (1) Dynamic MTD/YTD selector : PowerBI (reddit.com) ).
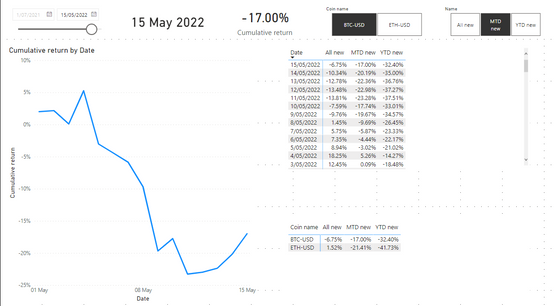
Basically, what I did was:
Created a 'copy' of the 'Calendar' table called 'Date selection' that serves as an 'extraction' tool for the range of dates I'm interested in. For example, dates from 1JUL2021 to 15MAY2022. (Initially, this table was disconnected from 'Calendar' but I connected it later to filter out unnecessary dates from the visuals).
Updated the measures in my Calculation Group ('Time intelligence new'). Below is the example for MTD measure.
This is the changes to my calculation items (example for MTD):
VAR selected_date = MAX ( 'Date selection'[Date] )

VAR min_date = DATE ( YEAR ( selected_date ), MONTH ( selected_date ), 1 )

VAR max_date = selected_date

RETURN IF ( OR ( MAX ( 'Calendar'[Date] ) > max_date, MAX ( 'Calendar'[Date] ) < min_date ), BLANK (),

CALCULATE ( SELECTEDMEASURE (),
	FILTER (ALL ( 'Calendar' ),
	'Calendar'[Date] >= min_date && 'Calendar'[Date] <= max_date && 'Calendar'[Date] <= MAX ( 'Calendar'[Date] )
		)
)
)
Seems to be working, but if you have any feedback (not really sure why this filtering logic works) or a better solution - keen to hear.
Thank you, Martin
- Mark as New
- Bookmark
- Subscribe
- Mute
- Subscribe to RSS Feed
- Permalink
- Report Inappropriate Content
Hi, @msagradian
I have an easy way to do this, but it may change your current view. But it is not possible in your matrix, it is possible in Table.
Measure =
IF (
    SELECTEDVALUE ( 'Time intelligence new'[Name] ) = "MTD new"
        && [Cumulative return] <> BLANK (),
    1,
    IF (
        SELECTEDVALUE ( 'Time intelligence new'[Name] ) = "YTD new"
            && [Cumulative return] <> BLANK (),
        1,
        0
    )
)
I tried to set Measure equal to 1 in your original matrix, but it works in the table view. Is this the result you expect?
Best Regards,
Community Support Team _Charlotte
If this post helps, then please consider Accept it as the solution to help the other members find it more quickly.
- Mark as New
- Bookmark
- Subscribe
- Mute
- Subscribe to RSS Feed
- Permalink
- Report Inappropriate Content
Thank you for your help and time @v-zhangti ,
This is an interesting way to approach this, I might give it a try. I think I got it working for me through a mix of solutions (posted it here: (1) Dynamic MTD/YTD selector : PowerBI (reddit.com) ).
Basically, what I did was:
Created a 'copy' of the 'Calendar' table called 'Date selection' that serves as an 'extraction' tool for the range of dates I'm interested in. For example, dates from 1JUL2021 to 15MAY2022. (Initially, this table was disconnected from 'Calendar' but I connected it later to filter out unnecessary dates from the visuals).
Updated the measures in my Calculation Group ('Time intelligence new'). Below is the example for MTD measure.
This is the changes to my calculation items (example for MTD):
VAR selected_date = MAX ( 'Date selection'[Date] )

VAR min_date = DATE ( YEAR ( selected_date ), MONTH ( selected_date ), 1 )

VAR max_date = selected_date

RETURN IF ( OR ( MAX ( 'Calendar'[Date] ) > max_date, MAX ( 'Calendar'[Date] ) < min_date ), BLANK (),

CALCULATE ( SELECTEDMEASURE (),
	FILTER (ALL ( 'Calendar' ),
	'Calendar'[Date] >= min_date && 'Calendar'[Date] <= max_date && 'Calendar'[Date] <= MAX ( 'Calendar'[Date] )
		)
)
)
Seems to be working, but if you have any feedback (not really sure why this filtering logic works) or a better solution - keen to hear.
Thank you, Martin
Helpful resources

Microsoft Fabric Learn Together
Covering the world! 9:00-10:30 AM Sydney, 4:00-5:30 PM CET (Paris/Berlin), 7:00-8:30 PM Mexico City

Power BI Monthly Update - April 2024
Check out the April 2024 Power BI update to learn about new features.

| User | Count |
|---|---|
| 105 | |
| 105 | |
| 88 | |
| 73 | |
| 66 |
| User | Count |
|---|---|
| 122 | |
| 112 | |
| 98 | |
| 79 | |
| 72 |


