- Power BI forums
- Updates
- News & Announcements
- Get Help with Power BI
- Desktop
- Service
- Report Server
- Power Query
- Mobile Apps
- Developer
- DAX Commands and Tips
- Custom Visuals Development Discussion
- Health and Life Sciences
- Power BI Spanish forums
- Translated Spanish Desktop
- Power Platform Integration - Better Together!
- Power Platform Integrations (Read-only)
- Power Platform and Dynamics 365 Integrations (Read-only)
- Training and Consulting
- Instructor Led Training
- Dashboard in a Day for Women, by Women
- Galleries
- Community Connections & How-To Videos
- COVID-19 Data Stories Gallery
- Themes Gallery
- Data Stories Gallery
- R Script Showcase
- Webinars and Video Gallery
- Quick Measures Gallery
- 2021 MSBizAppsSummit Gallery
- 2020 MSBizAppsSummit Gallery
- 2019 MSBizAppsSummit Gallery
- Events
- Ideas
- Custom Visuals Ideas
- Issues
- Issues
- Events
- Upcoming Events
- Community Blog
- Power BI Community Blog
- Custom Visuals Community Blog
- Community Support
- Community Accounts & Registration
- Using the Community
- Community Feedback
Register now to learn Fabric in free live sessions led by the best Microsoft experts. From Apr 16 to May 9, in English and Spanish.
- Power BI forums
- Forums
- Get Help with Power BI
- Desktop
- Displaying the Average Per Type of a Non-Sliced Co...
- Subscribe to RSS Feed
- Mark Topic as New
- Mark Topic as Read
- Float this Topic for Current User
- Bookmark
- Subscribe
- Printer Friendly Page
- Mark as New
- Bookmark
- Subscribe
- Mute
- Subscribe to RSS Feed
- Permalink
- Report Inappropriate Content
Displaying the Average Per Type of a Non-Sliced Column
Hi all, I was wondering if anyone may be able to help with a solution to the following:
We have a source data table that has a list of locations, that location's 'Location Type', and that location's score against a series of metrics. A simplified example of what this data table looks like is as follows:
In PowerBI, we would like the user to be able to select a location number from a slicer and to see that location's score against each metric, compared to the Average Figure for that location's location type. A simplified example of the desired result looks something like this:
We have tried using a Matrix visual, and various different approaches for for getting these figures side by side. We have tried using measures and calculated columns to acheive this, but are struggling to solve this. When we have a calculated column, we are struggling to get this presented side by side in a matrix!
If anyone may be able to help us with a solution to this, it would be very much appreciated!
Solved! Go to Solution.
- Mark as New
- Bookmark
- Subscribe
- Mute
- Subscribe to RSS Feed
- Permalink
- Report Inappropriate Content
Step 1: Unpivot your data
should look like this:
Step 2: You need 3 measures:
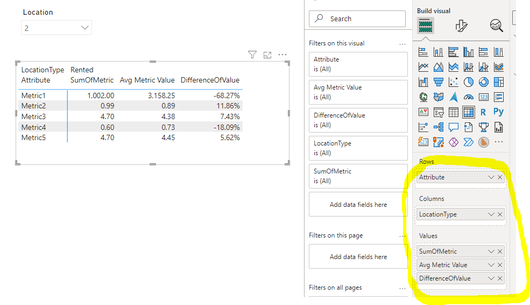
Step 3: Add fields to matrix
You can then rename the fields in the "Values" section of above. SumOfMetric will always be the values for the chosen location.
Step 4: Mark this post as the solution and give Kudos if you feel so inclined.
- Mark as New
- Bookmark
- Subscribe
- Mute
- Subscribe to RSS Feed
- Permalink
- Report Inappropriate Content
Thank you very much, this looks like it might be the one! We'll give it a try and confirm!!
- Mark as New
- Bookmark
- Subscribe
- Mute
- Subscribe to RSS Feed
- Permalink
- Report Inappropriate Content
Sure. Some minor things. Turn off column and row sums on matrix.
Formatting of values to reflect %, $, etc. will be another hurdle.
- Mark as New
- Bookmark
- Subscribe
- Mute
- Subscribe to RSS Feed
- Permalink
- Report Inappropriate Content
We can confirm that this is the solution - thank you again very much for the help! We have indeed now hit those %, $ etc. hurdles and will have a go at trying to sort them. Thanks!
Helpful resources

Microsoft Fabric Learn Together
Covering the world! 9:00-10:30 AM Sydney, 4:00-5:30 PM CET (Paris/Berlin), 7:00-8:30 PM Mexico City

Power BI Monthly Update - April 2024
Check out the April 2024 Power BI update to learn about new features.

| User | Count |
|---|---|
| 113 | |
| 103 | |
| 76 | |
| 66 | |
| 63 |
| User | Count |
|---|---|
| 142 | |
| 105 | |
| 102 | |
| 81 | |
| 68 |


