Jumpstart your career with the Fabric Career Hub
Find everything you need to get certified on Fabric—skills challenges, live sessions, exam prep, role guidance, and a 50 percent discount on exams.
Get started- Power BI forums
- Updates
- News & Announcements
- Get Help with Power BI
- Desktop
- Service
- Report Server
- Power Query
- Mobile Apps
- Developer
- DAX Commands and Tips
- Custom Visuals Development Discussion
- Health and Life Sciences
- Power BI Spanish forums
- Translated Spanish Desktop
- Power Platform Integration - Better Together!
- Power Platform Integrations (Read-only)
- Power Platform and Dynamics 365 Integrations (Read-only)
- Training and Consulting
- Instructor Led Training
- Dashboard in a Day for Women, by Women
- Galleries
- Community Connections & How-To Videos
- COVID-19 Data Stories Gallery
- Themes Gallery
- Data Stories Gallery
- R Script Showcase
- Webinars and Video Gallery
- Quick Measures Gallery
- 2021 MSBizAppsSummit Gallery
- 2020 MSBizAppsSummit Gallery
- 2019 MSBizAppsSummit Gallery
- Events
- Ideas
- Custom Visuals Ideas
- Issues
- Issues
- Events
- Upcoming Events
- Community Blog
- Power BI Community Blog
- Custom Visuals Community Blog
- Community Support
- Community Accounts & Registration
- Using the Community
- Community Feedback
Earn a 50% discount on the DP-600 certification exam by completing the Fabric 30 Days to Learn It challenge.
- Power BI forums
- Forums
- Get Help with Power BI
- Desktop
- Date relationship not working / plotting multiple ...
- Subscribe to RSS Feed
- Mark Topic as New
- Mark Topic as Read
- Float this Topic for Current User
- Bookmark
- Subscribe
- Printer Friendly Page
- Mark as New
- Bookmark
- Subscribe
- Mute
- Subscribe to RSS Feed
- Permalink
- Report Inappropriate Content
Date relationship not working / plotting multiple lines vs. dates
I would like to plot normalized work progress and hours used on a single axis, as follows:
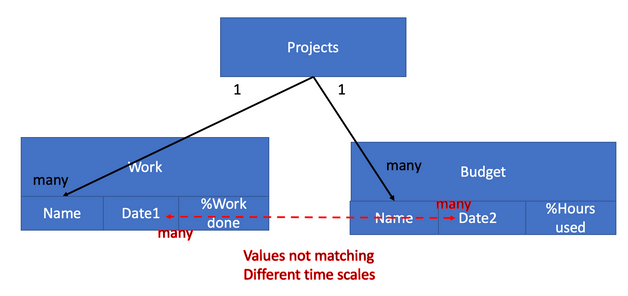
I have a general table with project information that is related to two further tables that contain the work progress and hours used for multiple projects. The tables, columns and relationships are displayed here:
However, the date relationship does not work in my case. I cannot make it active due to the the active relationship to the Project table. I also cannot get the relationship to work if I remove the relationships to the project table because usually none of the date values from the Work table match the date values from the Budget table.
I would really appreciate any advice on how to solve this problem.
- Mark as New
- Bookmark
- Subscribe
- Mute
- Subscribe to RSS Feed
- Permalink
- Report Inappropriate Content
I recommend you set up a Date table with continuous dates covering the range of dates in the model. You can then also use Time Intelligence functions
Did I answer your question? Mark my post as a solution!
In doing so, you are also helping me. Thank you!
Proud to be a Super User!
Paul on Linkedin.
- Mark as New
- Bookmark
- Subscribe
- Mute
- Subscribe to RSS Feed
- Permalink
- Report Inappropriate Content
Thanks, I set this up and I feel this is the right approach, but there is a new problem:
On the upper graph I plotted work progress (0...1) vs the newly set-up date table (red line), which shows correctly. The % hours used (dark blue) are displayed wrong vs the new date table. There is a factor 100 between the displayed and the calculated value and the order of the values linked to the new date table is wrong.
The lower graph shows the correct data of % hours used vs. the old date in the table.
Maybe you can see where I went wrong.
- Mark as New
- Bookmark
- Subscribe
- Mute
- Subscribe to RSS Feed
- Permalink
- Report Inappropriate Content
Hello @rogerk,
You can change the active relationship in a measure. Something like this:
MeasureForWork = CALCULATE(SUM(%WorkDone), USERELATIONSHIP(Date1,Date2))
Then use Date2 on the x axis and represent MeasureForWork and the %Hours column
Helpful resources
| User | Count |
|---|---|
| 90 | |
| 74 | |
| 67 | |
| 63 | |
| 55 |
| User | Count |
|---|---|
| 101 | |
| 92 | |
| 74 | |
| 60 | |
| 59 |


