- Power BI forums
- Updates
- News & Announcements
- Get Help with Power BI
- Desktop
- Service
- Report Server
- Power Query
- Mobile Apps
- Developer
- DAX Commands and Tips
- Custom Visuals Development Discussion
- Health and Life Sciences
- Power BI Spanish forums
- Translated Spanish Desktop
- Power Platform Integration - Better Together!
- Power Platform Integrations (Read-only)
- Power Platform and Dynamics 365 Integrations (Read-only)
- Training and Consulting
- Instructor Led Training
- Dashboard in a Day for Women, by Women
- Galleries
- Community Connections & How-To Videos
- COVID-19 Data Stories Gallery
- Themes Gallery
- Data Stories Gallery
- R Script Showcase
- Webinars and Video Gallery
- Quick Measures Gallery
- 2021 MSBizAppsSummit Gallery
- 2020 MSBizAppsSummit Gallery
- 2019 MSBizAppsSummit Gallery
- Events
- Ideas
- Custom Visuals Ideas
- Issues
- Issues
- Events
- Upcoming Events
- Community Blog
- Power BI Community Blog
- Custom Visuals Community Blog
- Community Support
- Community Accounts & Registration
- Using the Community
- Community Feedback
Register now to learn Fabric in free live sessions led by the best Microsoft experts. From Apr 16 to May 9, in English and Spanish.
- Power BI forums
- Forums
- Get Help with Power BI
- Desktop
- Re: DAX for deltas
- Subscribe to RSS Feed
- Mark Topic as New
- Mark Topic as Read
- Float this Topic for Current User
- Bookmark
- Subscribe
- Printer Friendly Page
- Mark as New
- Bookmark
- Subscribe
- Mute
- Subscribe to RSS Feed
- Permalink
- Report Inappropriate Content
DAX for deltas
Hi,
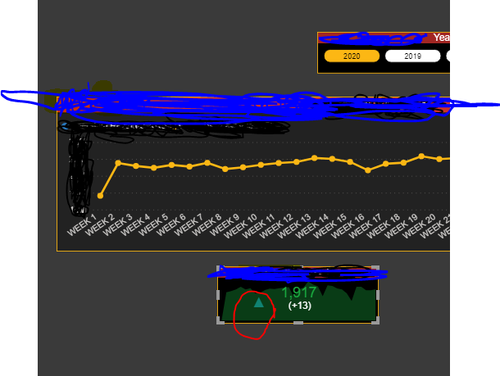
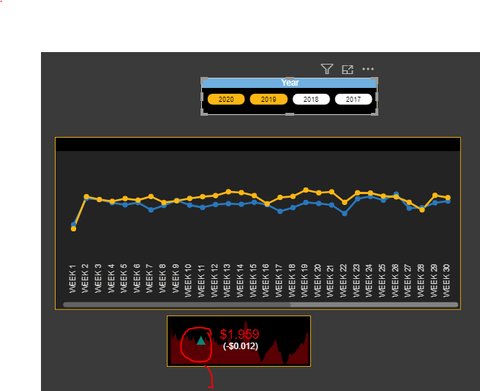
I am trying to show trend line with data for about a two years. i have created year slicers for the last three years. So when I click the slicer for the current year the data seems to right and the trend line is showing what I need( difference between this weeks data and the previous week with delta sign). When I click the previous year and current year on the slicer , I am able to see two trend lines , but when I click on the data points, the delta sign in the KPI card is showing reverse . For example, when I select data for 2019 and 2020 and August 3rd week, it is performing the difference between current week and previous week for 2019 and difference between current and previous week of 2020 , and perfomring the sum of both the results and showing on the delta KPI. What i need is the diffrence between weeks for individual year based on which data point is selected. ( 2020 or 2019 etc).
Below are the 6 measure i'm using . Top 4 for delta in the card and last 2 for line graph.
- Mark as New
- Bookmark
- Subscribe
- Mute
- Subscribe to RSS Feed
- Permalink
- Report Inappropriate Content
What I can think is to create a slicer table for 2019 and 2020, then filter the trend measures to be displayed in the chart. Please see the attatched sample pbix, I used random values just to show the idea.
Paul Zheng _ Community Support Team
If this post helps, then please consider Accept it as the solution to help the other members find it more quickly.
- Mark as New
- Bookmark
- Subscribe
- Mute
- Subscribe to RSS Feed
- Permalink
- Report Inappropriate Content
The measure which i create is working fine. when i select single year delta(up or down arrow) are working fine.
But when I select trend line for multipul years if the user clicks on any of the data point in one of the trend line it sums up the value for that particular week for all the year give the delta based on the sum we get for particular week.
Measure used for creating line graph:
- Mark as New
- Bookmark
- Subscribe
- Mute
- Subscribe to RSS Feed
- Permalink
- Report Inappropriate Content
@vkasula01 , See if my week on week blog can help
Power BI — WTD
https://medium.com/@amitchandak.1978/power-bi-wtd-questions-time-intelligence-4-5-98c30fab69d3
https://community.powerbi.com/t5/Community-Blog/Week-Is-Not-So-Weak-WTD-Last-WTD-and-This-Week-vs-La...
example
Week Rank = RANKX(all('Date'),'Date'[Week Start date],,ASC,Dense)
This Week = CALCULATE(sum('order'[Qty]), FILTER(ALL('Date'),'Date'[Week Rank]=max('Date'[Week Rank])))
Last Week = CALCULATE(sum('order'[Qty]), FILTER(ALL('Date'),'Date'[Week Rank]=max('Date'[Week Rank])-1))
Last year Week= CALCULATE(sum('order'[Qty]), FILTER(ALL('Date'),'Date'[Week Rank]=(max('Date'[Week Rank]) -52)))
Microsoft Power BI Learning Resources, 2023 !!
Learn Power BI - Full Course with Dec-2022, with Window, Index, Offset, 100+ Topics !!
Did I answer your question? Mark my post as a solution! Appreciate your Kudos !! Proud to be a Super User! !!
- Mark as New
- Bookmark
- Subscribe
- Mute
- Subscribe to RSS Feed
- Permalink
- Report Inappropriate Content
The measure which I create is working fine. when I select single year delta(up or down arrow) are working fine.
But when I select trend line for multipul years if the user clicks on any of the data point in one of the trend line it sums up the value for that particular week for all the year give the delta based on the sum we get for particular week.
Measure used for creating line graph:
Helpful resources

Microsoft Fabric Learn Together
Covering the world! 9:00-10:30 AM Sydney, 4:00-5:30 PM CET (Paris/Berlin), 7:00-8:30 PM Mexico City

Power BI Monthly Update - April 2024
Check out the April 2024 Power BI update to learn about new features.

| User | Count |
|---|---|
| 106 | |
| 104 | |
| 79 | |
| 68 | |
| 61 |
| User | Count |
|---|---|
| 144 | |
| 104 | |
| 103 | |
| 82 | |
| 70 |


