Hi @Anonymous,
I don't know how to calculate the cost. But you can change it yourself. Please download the demo in the attachment.
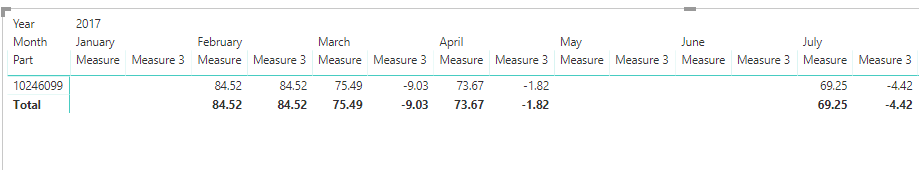
Measure 3 =
VAR lastMonth =
    CALCULATE (
        MONTH ( MAX ( 'Table1'[Period] ) ),
        FILTER ( ALL ( 'Calendar'[Date] ), 'Calendar'[Date] < MIN ( 'Calendar'[Date] ) )
    )
VAR costLastMonth =
    CALCULATE (
        DIVIDE (
            SUMX (
                'Table1',
                'Table1'[Burden Actual Cost] + 'Table1'[Labor Actual Cost]
                    + 'Table1'[Labor Var Inventory Value]
                    + Table1[Mtl Actual Cost]
            ),
            SUM ( Table1[Qty] )
        ),
        FILTER ( ALL ( 'Calendar'[Date] ), MONTH ( 'Calendar'[Date] ) = lastMonth )
    )
VAR costThisMonth =
    DIVIDE (
        SUMX (
            'Table1',
            'Table1'[Burden Actual Cost] + 'Table1'[Labor Actual Cost]
                + 'Table1'[Labor Var Inventory Value]
                + Table1[Mtl Actual Cost]
        ),
        SUM ( Table1[Qty] )
    )
RETURN
    IF ( ISBLANK ( costThisMonth ), BLANK (), costThisMonth - costLastMonth )
Best Regards,
Dale
Community Support Team _ Dale
If this post helps, then please consider Accept it as the solution to help the other members find it more quickly.


