Earn a 50% discount on the DP-600 certification exam by completing the Fabric 30 Days to Learn It challenge.
So I am fairly new to PowerBI and am having some issues figuring out how to do this:
I have a continuous stream of data that is recorded every minute. I need to be able to calculate the arithmatic average of two hours worth of data and present it alongside the actual data. In the end it would need to look something like this:
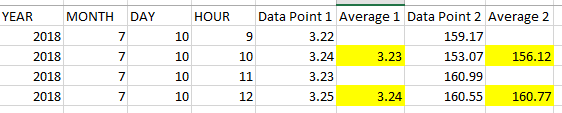
The columns in yellow are what I'm trying to calculate. I have the rest of the data.
Any help would be appreciated
Solved! Go to Solution.
OK, so that should be something along the lines of:
Column = AVERAGEX( FILTER(ALL('Table'),
[YEAR]=EARLIER([YEAR])
&& [MONTH]=EARLIER([MONTH])
&& [DAY]=EARLIER([DAY])
&& [HOUR]<=EARLIER([HOUR])
&& [HOUR]>=EARLIER([HOUR])-1
),
[Data Point 1]
)
Rinse and repeat for Average 2 column using [Data Point 2] in place of [Data Point 1].