- Power BI forums
- Updates
- News & Announcements
- Get Help with Power BI
- Desktop
- Service
- Report Server
- Power Query
- Mobile Apps
- Developer
- DAX Commands and Tips
- Custom Visuals Development Discussion
- Health and Life Sciences
- Power BI Spanish forums
- Translated Spanish Desktop
- Power Platform Integration - Better Together!
- Power Platform Integrations (Read-only)
- Power Platform and Dynamics 365 Integrations (Read-only)
- Training and Consulting
- Instructor Led Training
- Dashboard in a Day for Women, by Women
- Galleries
- Community Connections & How-To Videos
- COVID-19 Data Stories Gallery
- Themes Gallery
- Data Stories Gallery
- R Script Showcase
- Webinars and Video Gallery
- Quick Measures Gallery
- 2021 MSBizAppsSummit Gallery
- 2020 MSBizAppsSummit Gallery
- 2019 MSBizAppsSummit Gallery
- Events
- Ideas
- Custom Visuals Ideas
- Issues
- Issues
- Events
- Upcoming Events
- Community Blog
- Power BI Community Blog
- Custom Visuals Community Blog
- Community Support
- Community Accounts & Registration
- Using the Community
- Community Feedback
Earn a 50% discount on the DP-600 certification exam by completing the Fabric 30 Days to Learn It challenge.
- Power BI forums
- Forums
- Get Help with Power BI
- Desktop
- Re: Backlog tickets
- Subscribe to RSS Feed
- Mark Topic as New
- Mark Topic as Read
- Float this Topic for Current User
- Bookmark
- Subscribe
- Printer Friendly Page
- Mark as New
- Bookmark
- Subscribe
- Mute
- Subscribe to RSS Feed
- Permalink
- Report Inappropriate Content
Backlog tickets
Hi
I am creating dashboard for our department ,
I want to present the backlog tickets in 2 different chart .
1st chart : tickets the created < 4 days - for this chart I did it using filter pane
2nd chart : ticket the created >= 4 days - need your support 😊
pbix file in below link
https://drive.google.com/file/d/16V5VjACKXAJHL7IzLj9R9WKfnsPxfcM4/view?usp=sharing
Solved! Go to Solution.
- Mark as New
- Bookmark
- Subscribe
- Mute
- Subscribe to RSS Feed
- Permalink
- Report Inappropriate Content
Hi , @Anonymous
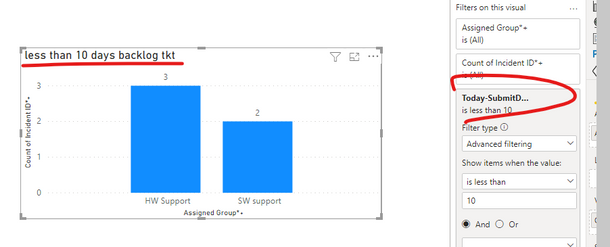
In your sample , I found that 1st chart :tickets the created <4 days , you are using a relative date filter pane to achieve it.
In fact ,you can create a calculated column 'Today-SubmitDate' :
Today-SubmitDate = DATEDIFF(Sheet1[Submit Date],TODAY(),DAY)
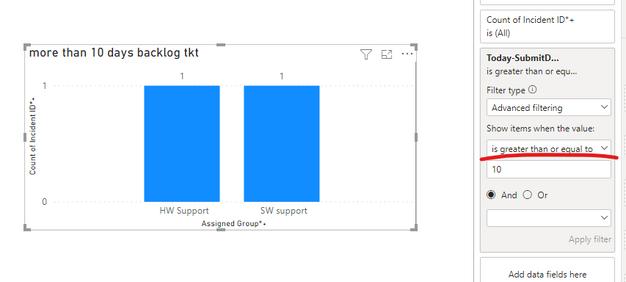
Then apply 'Today-SubmitDate' to filter pane to filter this visual as below:
1st chart : tickets the created < 10 days :
2nd chart : ticket the created >= 10 days
Please check my sample file for more details.
Best Regards,
Community Support Team _ Eason
If this post helps, then please consider Accept it as the solution to help the other members find it more quickly.
- Mark as New
- Bookmark
- Subscribe
- Mute
- Subscribe to RSS Feed
- Permalink
- Report Inappropriate Content
Hi @Anonymous ,
You can create a table or matrix with the two categories:
1) <4 days
2) >=4 days
Now create two measures to get the corresponding values. The code would look something like below:
1) For <4:
DelayedTickets =
VAR TimeFrame = 4
VAR backlog =
    COUNTROWS (
        FILTER (
            'YourTable',
            IF ( 'YourTable'[YourColumn]
                 < TimeFrame,
                1,
                0
            )
        )
    )
RETURN
    backlog
Similarly for >=4 days
I hope this will suffice your requirement
Helpful resources
| User | Count |
|---|---|
| 107 | |
| 89 | |
| 81 | |
| 76 | |
| 73 |
| User | Count |
|---|---|
| 112 | |
| 104 | |
| 96 | |
| 74 | |
| 66 |


