- Power BI forums
- Updates
- News & Announcements
- Get Help with Power BI
- Desktop
- Service
- Report Server
- Power Query
- Mobile Apps
- Developer
- DAX Commands and Tips
- Custom Visuals Development Discussion
- Health and Life Sciences
- Power BI Spanish forums
- Translated Spanish Desktop
- Power Platform Integration - Better Together!
- Power Platform Integrations (Read-only)
- Power Platform and Dynamics 365 Integrations (Read-only)
- Training and Consulting
- Instructor Led Training
- Dashboard in a Day for Women, by Women
- Galleries
- Community Connections & How-To Videos
- COVID-19 Data Stories Gallery
- Themes Gallery
- Data Stories Gallery
- R Script Showcase
- Webinars and Video Gallery
- Quick Measures Gallery
- 2021 MSBizAppsSummit Gallery
- 2020 MSBizAppsSummit Gallery
- 2019 MSBizAppsSummit Gallery
- Events
- Ideas
- Custom Visuals Ideas
- Issues
- Issues
- Events
- Upcoming Events
- Community Blog
- Power BI Community Blog
- Custom Visuals Community Blog
- Community Support
- Community Accounts & Registration
- Using the Community
- Community Feedback
Earn a 50% discount on the DP-600 certification exam by completing the Fabric 30 Days to Learn It challenge.
- Power BI forums
- Forums
- Get Help with Power BI
- Desktop
- Re: Background Color on Measure (Text Field)
- Subscribe to RSS Feed
- Mark Topic as New
- Mark Topic as Read
- Float this Topic for Current User
- Bookmark
- Subscribe
- Printer Friendly Page
- Mark as New
- Bookmark
- Subscribe
- Mute
- Subscribe to RSS Feed
- Permalink
- Report Inappropriate Content
Background Color on Measure (Text Field)
Hi Team,
I have created an measure that takes Max of Color and I put that in the matrix.
Measure = Max(Table1[Color])
This is what data looks like:
| Company | Measure |
| C1 | 0_Green |
| C2 | 3_Red |
| C3 | 2_Yellow |
| C4 | 1_Blue |
I have added this measure in my matrix. How do i background color on this measure considering I'm taking a max?
I tried creating a mesaure:
Measure 2: Var c = SelectedValue() Return if c = 0_Green, "Green", False, but it wont let me select Measure
I would like 0_Green to have Green etc.
Solved! Go to Solution.
- Mark as New
- Bookmark
- Subscribe
- Mute
- Subscribe to RSS Feed
- Permalink
- Report Inappropriate Content
You can reference your measure? Are you confused because I've named my measure 'Measure' and you already have a measure called 'Measure'?
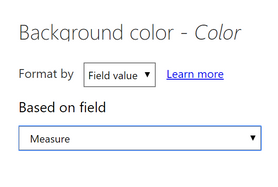
Here, try this as measure. Then select this measure BGColor in the Conditional Formatting dialogue.
BGColor =
VAR col = [Measure]
RETURN
IF(col = "3_red", "Red",
    IF(col = "0_green", "Green",
        IF(col = "2_yellow", "Yellow",
            IF(col = "1_blue", "Blue", "White"))))
Kind regards
Djerro123
-------------------------------
If this answered your question, please mark it as the Solution. This also helps others to find what they are looking for.
Kudo's are welcome 🙂
Did I answer your question? Mark my post as a solution!
Proud to be a Super User!
- Mark as New
- Bookmark
- Subscribe
- Mute
- Subscribe to RSS Feed
- Permalink
- Report Inappropriate Content
I've recreated your table in PowerBI and created the following measure:
Measure =
VAR col = SELECTEDVALUE('Table'[Color], "Grey")
RETURN
IF(col = "3_red", "Red",
    IF(col = "0_green", "Green",
        IF(col = "2_yellow", "Yellow",
            IF(col = "1_blue", "Blue", col))))
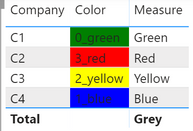
Then I put everything in a table visual, resulting in the following table:
I was able to set the conditional formatting of any column, based on a value (of Measure, in this case):


Note that the measure could be a lot easier if all your values are in the format of x_color, by taking the substring rather then a long nested IF statement. If there could be multiple numbers before the underscore, than this wouldn't work but that's another problem then 😉
Measure 2 =
VAR col = SELECTEDVALUE('Table'[Color], "0_white")
RETURN
RIGHT(col, (LEN(col)-2))
Kind regards
Djerro123
-------------------------------
If this answered your question, please mark it as the Solution. This also helps others to find what they are looking for.
Kudo's are welcome 🙂
Did I answer your question? Mark my post as a solution!
Proud to be a Super User!
- Mark as New
- Bookmark
- Subscribe
- Mute
- Subscribe to RSS Feed
- Permalink
- Report Inappropriate Content
@JarroVGIT How do I keep my Max Measure? I understand what you are tying to do. But I need to keep that Max Measure on my Matrix then apply the color on top of it. I have a lot of companies.
- Mark as New
- Bookmark
- Subscribe
- Mute
- Subscribe to RSS Feed
- Permalink
- Report Inappropriate Content
You can reference your measure? Are you confused because I've named my measure 'Measure' and you already have a measure called 'Measure'?
Here, try this as measure. Then select this measure BGColor in the Conditional Formatting dialogue.
BGColor =
VAR col = [Measure]
RETURN
IF(col = "3_red", "Red",
    IF(col = "0_green", "Green",
        IF(col = "2_yellow", "Yellow",
            IF(col = "1_blue", "Blue", "White"))))
Kind regards
Djerro123
-------------------------------
If this answered your question, please mark it as the Solution. This also helps others to find what they are looking for.
Kudo's are welcome 🙂
Did I answer your question? Mark my post as a solution!
Proud to be a Super User!
- Mark as New
- Bookmark
- Subscribe
- Mute
- Subscribe to RSS Feed
- Permalink
- Report Inappropriate Content
@DJ I messed it up. I selected the column. THanks for help. That actually fixed my issue.
- Mark as New
- Bookmark
- Subscribe
- Mute
- Subscribe to RSS Feed
- Permalink
- Report Inappropriate Content
Create a numeric measure and then do a conditional formatting on the desired column using that measure:
Color measure =
Switch(
[Company] ;
"C1" ; 1 ;
"C2" ; 2 ;
"C3" ; 3 ;
"C4" ; 4
)
Connect on LinkedIn
Helpful resources
| User | Count |
|---|---|
| 103 | |
| 87 | |
| 77 | |
| 70 | |
| 69 |
| User | Count |
|---|---|
| 113 | |
| 99 | |
| 97 | |
| 72 | |
| 68 |


