Register now to learn Fabric in free live sessions led by the best Microsoft experts. From Apr 16 to May 9, in English and Spanish.
Hi all,
I am using the ArcGIS map (pro subscription). I have set a reference layer of electoral districts.
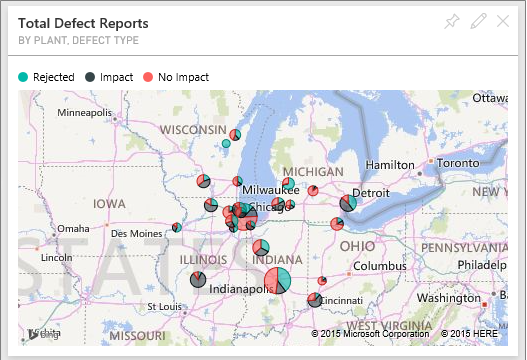
Now I want data I have related to those districts to display in the map, in each district as pic-charts.
So a bit like the attached, but the pic-charts constrained with the relevant districts.
What I have done:
- Added in reference layer of particular type (the country/electorcal district layer)
- Set location type = boundry
- Set location for single country (named)
- Set location type to 'Electoral divisions'
- Set Location type to 'exact match'
I have also created a column in my datraset that has a locaiton name the same as the 'district names' shown on the layer
When I try to load, no data point show, and I get an error at the bottom of the map 'Failed to load 30 features'
Anyone got any ideas?
thanks.
Allen.
Hi @allenoneill,
Could you share how to create that map with vizzes show on the map? I am also trying to link map and the data so analysis can be done when you click on the line or polygon feature on the map in Power BI.
Many thanks!!
HI @allenoneill,
Current I haven't found any document told you how to setting data point to correspond with reference layer shapes.
I'd like to suggest you contact to arcgis team to confirm this feature.
Regards,
Xiaoxin Sheng
Covering the world! 9:00-10:30 AM Sydney, 4:00-5:30 PM CET (Paris/Berlin), 7:00-8:30 PM Mexico City
Check out the April 2024 Power BI update to learn about new features.
User | Count |
---|---|
105 | |
94 | |
75 | |
63 | |
62 |
User | Count |
---|---|
137 | |
105 | |
104 | |
80 | |
63 |