- Power BI forums
- Updates
- News & Announcements
- Get Help with Power BI
- Desktop
- Service
- Report Server
- Power Query
- Mobile Apps
- Developer
- DAX Commands and Tips
- Custom Visuals Development Discussion
- Health and Life Sciences
- Power BI Spanish forums
- Translated Spanish Desktop
- Power Platform Integration - Better Together!
- Power Platform Integrations (Read-only)
- Power Platform and Dynamics 365 Integrations (Read-only)
- Training and Consulting
- Instructor Led Training
- Dashboard in a Day for Women, by Women
- Galleries
- Community Connections & How-To Videos
- COVID-19 Data Stories Gallery
- Themes Gallery
- Data Stories Gallery
- R Script Showcase
- Webinars and Video Gallery
- Quick Measures Gallery
- 2021 MSBizAppsSummit Gallery
- 2020 MSBizAppsSummit Gallery
- 2019 MSBizAppsSummit Gallery
- Events
- Ideas
- Custom Visuals Ideas
- Issues
- Issues
- Events
- Upcoming Events
- Community Blog
- Power BI Community Blog
- Custom Visuals Community Blog
- Community Support
- Community Accounts & Registration
- Using the Community
- Community Feedback
Register now to learn Fabric in free live sessions led by the best Microsoft experts. From Apr 16 to May 9, in English and Spanish.
- Power BI forums
- Forums
- Get Help with Power BI
- DAX Commands and Tips
- Need Urgent HELP! on DAX
- Subscribe to RSS Feed
- Mark Topic as New
- Mark Topic as Read
- Float this Topic for Current User
- Bookmark
- Subscribe
- Printer Friendly Page
- Mark as New
- Bookmark
- Subscribe
- Mute
- Subscribe to RSS Feed
- Permalink
- Report Inappropriate Content
Need Urgent HELP! on DAX
Dear All,
I want to show the sub total in a separate column in the matrix visual as shown in the screenshot.
Population is a measure, not a direct column from the database.
NOTE: Country is from different table and State is from different table.
Same State Name will be there in different countries
Can someone please help me around with this?
Thank you.
Solved! Go to Solution.
- Mark as New
- Bookmark
- Subscribe
- Mute
- Subscribe to RSS Feed
- Permalink
- Report Inappropriate Content
Hi @Newbie12345
@gmsamborn Thank you very much for your prompt reply, and here allow me to make some comments of my own.
Power BI does not inherently support displaying subtotals in separate columns within the same matrix. However, you can create a separate visual to show totals.
For your question, here is the method I provided:
Check to see if there is a relationship between the "Country" and "State" tables in the model. If not, make sure there is a public key that links these tables directly or indirectly.
Since you mentioned that "Population" is a metric and not a direct column, you will need to create a metric using DAX to correctly calculate subtotals for different states and countries.
Sub Total =
SUMX(
    FILTER(
        'Country / State',
        'Country / State'[Country] = MAX('Country / State'[Country])
    ),
    'Country / State'[Measure Population]
)
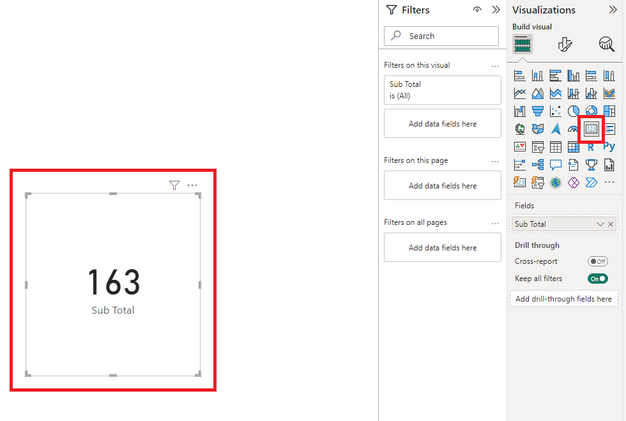
You can create a card for displaying Sub Total.
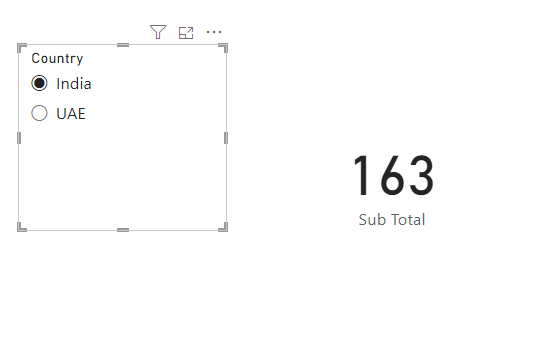
Also used in conjunction with the slicer for showing population totals under different countries.
Regards,
Nono Chen
If this post helps, then please consider Accept it as the solution to help the other members find it more quickly.
- Mark as New
- Bookmark
- Subscribe
- Mute
- Subscribe to RSS Feed
- Permalink
- Report Inappropriate Content
SubTotal = CALCULATE([Population], ALL(YourStateTable))
- Mark as New
- Bookmark
- Subscribe
- Mute
- Subscribe to RSS Feed
- Permalink
- Report Inappropriate Content
Dear @lukiz84 ,
Thanks for your response!
The problem here is, I have same state name in other countries too, so we can not use ALL,
I tries ALLEXCEP as well but since it is a matrix, it is giving row level value along with subtotal.
Want I am trying to get here is, only Subtotal like a merged single value (as shown in the screenshot above)
- Mark as New
- Bookmark
- Subscribe
- Mute
- Subscribe to RSS Feed
- Permalink
- Report Inappropriate Content
Hi @Newbie12345
I'm not sure you can make a matrix column appear to be a Excel merged column.
Regarding your measure, would this help?
Subtotal =
    IF(
        NOT HASONEVALUE( 'Table'[State] ),
        CALCULATE(
            SUM( 'Table'[Population] ),
            REMOVEFILTERS( 'Table'[State] )
        )
    )
I hope this helps.
Helpful resources

Microsoft Fabric Learn Together
Covering the world! 9:00-10:30 AM Sydney, 4:00-5:30 PM CET (Paris/Berlin), 7:00-8:30 PM Mexico City

Power BI Monthly Update - April 2024
Check out the April 2024 Power BI update to learn about new features.

| User | Count |
|---|---|
| 39 | |
| 25 | |
| 20 | |
| 14 | |
| 8 |
| User | Count |
|---|---|
| 71 | |
| 48 | |
| 46 | |
| 20 | |
| 16 |


