- Power BI forums
- Updates
- News & Announcements
- Get Help with Power BI
- Desktop
- Service
- Report Server
- Power Query
- Mobile Apps
- Developer
- DAX Commands and Tips
- Custom Visuals Development Discussion
- Health and Life Sciences
- Power BI Spanish forums
- Translated Spanish Desktop
- Power Platform Integration - Better Together!
- Power Platform Integrations (Read-only)
- Power Platform and Dynamics 365 Integrations (Read-only)
- Training and Consulting
- Instructor Led Training
- Dashboard in a Day for Women, by Women
- Galleries
- Community Connections & How-To Videos
- COVID-19 Data Stories Gallery
- Themes Gallery
- Data Stories Gallery
- R Script Showcase
- Webinars and Video Gallery
- Quick Measures Gallery
- 2021 MSBizAppsSummit Gallery
- 2020 MSBizAppsSummit Gallery
- 2019 MSBizAppsSummit Gallery
- Events
- Ideas
- Custom Visuals Ideas
- Issues
- Issues
- Events
- Upcoming Events
- Community Blog
- Power BI Community Blog
- Custom Visuals Community Blog
- Community Support
- Community Accounts & Registration
- Using the Community
- Community Feedback
Earn a 50% discount on the DP-600 certification exam by completing the Fabric 30 Days to Learn It challenge.
- Power BI forums
- Forums
- Get Help with Power BI
- DAX Commands and Tips
- Re: Difference between two sliced visuals, display...
- Subscribe to RSS Feed
- Mark Topic as New
- Mark Topic as Read
- Float this Topic for Current User
- Bookmark
- Subscribe
- Printer Friendly Page
- Mark as New
- Bookmark
- Subscribe
- Mute
- Subscribe to RSS Feed
- Permalink
- Report Inappropriate Content
Difference between two sliced visuals, displayed as a visual
Hi all,
I have tried finding the solution to my problem for a while now, but simply can't figure out a way. Finally decided that the only way forward is signing up here and ask for help.
The data looks roughly like this:
| Product | Month | profit |
| apple | 01-31-2023 | 1750 |
| orange | 01-31-2023 | -4000 |
| apple | 02-28-2023 | 1500 |
| orange | 02-28-2023 | -3900 |
| apple | 03-31-2023 | 1600 |
| orange | 03-31-2023 | -2500 |
| apple | 04-30-2023 | 1100 |
| orange | 04-30-2023 | 500 |
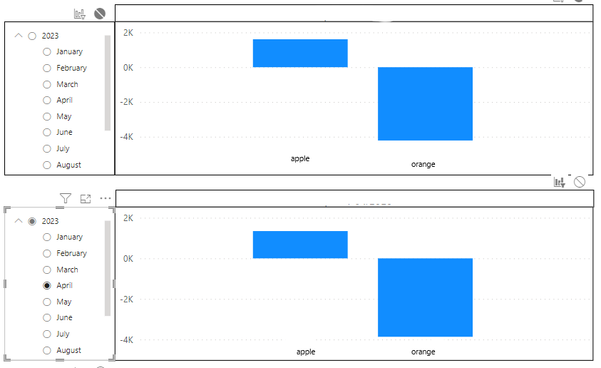
I have created two visuals with a slicer each. The slicer is assigned to each visual using Format --> Edit interactions
Below this, there should be another visual that displays - in the same format - the difference between the two chosen months for each product.
E.g. for January 2023 vs. February 2023 that visual should display a bar of -250 for apple and +100 for orange.
Thanks a lot for your help!
Solved! Go to Solution.
- Mark as New
- Bookmark
- Subscribe
- Mute
- Subscribe to RSS Feed
- Permalink
- Report Inappropriate Content
- Mark as New
- Bookmark
- Subscribe
- Mute
- Subscribe to RSS Feed
- Permalink
- Report Inappropriate Content
- Mark as New
- Bookmark
- Subscribe
- Mute
- Subscribe to RSS Feed
- Permalink
- Report Inappropriate Content
Hi @tamerj1
Thanks for the hint. I have now created two tables (table slicer 1 / table slicer 2) and assigned them to the two visuals.
Unfortunately I'm still having trouble displaying the difference. I have set up the following measure:
Difference3 =
VAR SelectedMonth1 = SELECTEDVALUE('Table slicer 1'[Date])
VAR SelectedMonth2 = SELECTEDVALUE('Table slicer 2'[Date])

return
    CALCULATE(SUM('Table slicer 1'[Value]),
    'Table slicer 1'[Date]=SelectedMonth1
    ) -

    CALCULATE(SUM('Table slicer 2'[Value]),
    'Table slicer 2'[Date]=SelectedMonth2
    )
The third visual displays the same values as the first visual but not the difference.
Can you please help me adjust the the measure 'Difference3' (or the visual), so that it displays the actual difference?
Many thanks!!!
- Mark as New
- Bookmark
- Subscribe
- Mute
- Subscribe to RSS Feed
- Permalink
- Report Inappropriate Content
Not 100% like this but it should also work. Make sure interaction is active between all visuals
- Mark as New
- Bookmark
- Subscribe
- Mute
- Subscribe to RSS Feed
- Permalink
- Report Inappropriate Content
It was indeed the interaction settings that prevented proper calculations 🙄
Helpful resources
| User | Count |
|---|---|
| 56 | |
| 22 | |
| 18 | |
| 16 | |
| 11 |
| User | Count |
|---|---|
| 85 | |
| 54 | |
| 39 | |
| 21 | |
| 18 |


