- Power BI forums
- Updates
- News & Announcements
- Get Help with Power BI
- Desktop
- Service
- Report Server
- Power Query
- Mobile Apps
- Developer
- DAX Commands and Tips
- Custom Visuals Development Discussion
- Health and Life Sciences
- Power BI Spanish forums
- Translated Spanish Desktop
- Power Platform Integration - Better Together!
- Power Platform Integrations (Read-only)
- Power Platform and Dynamics 365 Integrations (Read-only)
- Training and Consulting
- Instructor Led Training
- Dashboard in a Day for Women, by Women
- Galleries
- Community Connections & How-To Videos
- COVID-19 Data Stories Gallery
- Themes Gallery
- Data Stories Gallery
- R Script Showcase
- Webinars and Video Gallery
- Quick Measures Gallery
- 2021 MSBizAppsSummit Gallery
- 2020 MSBizAppsSummit Gallery
- 2019 MSBizAppsSummit Gallery
- Events
- Ideas
- Custom Visuals Ideas
- Issues
- Issues
- Events
- Upcoming Events
- Community Blog
- Power BI Community Blog
- Custom Visuals Community Blog
- Community Support
- Community Accounts & Registration
- Using the Community
- Community Feedback
Earn a 50% discount on the DP-600 certification exam by completing the Fabric 30 Days to Learn It challenge.
- Power BI forums
- Galleries
- Quick Measures Gallery
- Dynamic Measures/Titles (Using Parameter Table)


- Mark as New
- Bookmark
- Subscribe
- Mute
- Subscribe to RSS Feed
- Permalink
- Report Inappropriate Content
Dynamic Measures/Titles (Using Parameter Table)
Where you have a single numeric field (e.g. 'Value') in your table though each row represents a different measure name (and/or unit for example) then you can create a dynamic measure to be displayed in your report.
You will need to create a seperate table with a single column (e.g. through 'Enter Data' in the Query Editor) containing just the unique list of measure names, and use this field as a slicer.
In the example attached, there are multiple types of reading values, and each of these reading values can be expressed in one or more units of measure. A list of unique measure names is included as a table called pMeasuresList and each of the units of measure is in a table called pUnitNames. The fields from these two single column tables are included as slicers on each page.
The dynamic measure to then return the value of the selected measure name/unit of measure is:
Average Measure Value =
VAR MEASURENAME = IF(HASONEVALUE(pMeasuresList[Measure Names]),VALUES(pMeasuresList[Measure Names]),"Tidal Level")
VAR UNITNAME = IF(HASONEVALUE(pUnitNames[unitName]),VALUES(pUnitNames[unitName]),"mAOD")
RETURN
CALCULATE(AVERAGE(Readings[value]),'Measures 1'[qualifier]=MEASURENAME,'Measures 1'[unitName]=UNITNAME)
Note that this has a default value - so if the user has not made any slicer selections then it defaults to the reading "Tidal level" shown in Unit Of Measure 'mAOD'
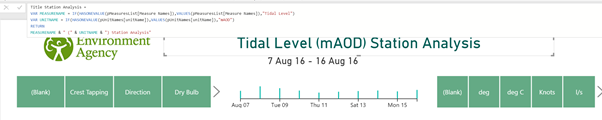
The same principle can be applied to the title, so that the report page title reflects what is being shown in the graphs:
Title Station Analysis =
VAR MEASURENAME = IF(HASONEVALUE(pMeasuresList[Measure Names]),VALUES(pMeasuresList[Measure Names]),"Tidal Level")
VAR UNITNAME = IF(HASONEVALUE(pUnitNames[unitName]),VALUES(pUnitNames[unitName]),"mAOD")
RETURN
MEASURENAME & " (" & UNITNAME & ") Station Analysis"
eyJrIjoiMmJlOGVkYjItMjY2OC00M2VjLTg3ZGQtNmRjNGUxNmEyNmYwIiwidCI6IjBjNzk5ZDM4LTQ3NjQtNDJiYy1iNGZmLTIzYmViYTljN2ZlMiIsImMiOjh9
- Mark as New
- Bookmark
- Subscribe
- Mute
- Subscribe to RSS Feed
- Permalink
- Report Inappropriate Content
Hi Rishi Sir,
I have only one words for you.. That is "Superb". No words after that. This is the real example of playing with visualization and DAX. I just started my Data Analyst career. Working in Power Bi since 2 months. This .pbix file is my inspiration and dream, that one day, i will be able to make this kind of visualization. I have learnt Power Bi from youtube, google and some blogs.So, your .pbix file will help me to learn more. Thanks a lot sir, for sharing this awesome creation with us. It will be a new milestone for newcommer like me.I have one question for you, hope you dont mind to answer this, how much experiences you have taken to achieve this level?
Thank one again sir and if you have any tips and advice for newbie like me, then please share.
Sincerely,
Sayam
- Mark as New
- Bookmark
- Subscribe
- Mute
- Subscribe to RSS Feed
- Permalink
- Report Inappropriate Content
Hi,
could ypu please tell me from where should i get current year example rain data and Historic flood warnings data?
Thanks,
Kailas S.
- Mark as New
- Bookmark
- Subscribe
- Mute
- Subscribe to RSS Feed
- Permalink
- Report Inappropriate Content
Hi
The Environment Agency data I used is available at http://environment.data.gov.uk/flood-monitoring/archive - this contains data both as CSVs and an API call
Thanks
Rishi