Table 2 =
Var col1 - SELECTCOLUMNS (Sheet2, "col1", Sheet2 [Test1])
Var col2 - SELECTCOLUMNS (Sheet2, "col2", Sheet2 [Test2])
was col3 - CROSSJOIN (col1, col2)
Var col4 - SELECTCOLUMNS (Sheet2, "col4", Sheet2 [Test2])
Var col5 - SELECTCOLUMNS (Sheet2, "col5", Sheet2 [Test3])
was col6 - CROSSJOIN (col4, col5)
Var col7 - SELECTCOLUMNS (Sheet2, "col7", Sheet2 [Test3])
Var col8 - SELECTCOLUMNS (Sheet2, "col8", Sheet2 [test4])
was col9 - CROSSJOIN (col7, col8)
var col10 - CONCATENATE (col4, col5)
return
SELECTCOLUMNS (ADDCOLUMNS (col6, "Concatcol", COMBINEVALUES (",", [col4], [col5])), "c1", [Concatcol])
Col3, Col6 and Col9 are the cross join columns now in the return code I have added for Col6, in the same way that I need to add col3 and Col9 and show all 3 columns in the calculated table.
Expected production
SELECTCOLUMNS (ADDCOLUMNS (col6, "Concatcol", COMBINEVALUES (",", [col4], [col5])), "c1", [Concatcol]),
SELECTCOLUMNS (ADDCOLUMNS (col3, "Concatcol1", COMBINEVALUES (",", [col1], [col2])), "c2", [Concatcol1])
I hope its a way, but I am a beginner in Power BI.
Sample data
| Test1 | Test2 | Test3 | test4 |
| one | one | Jobs | one |
| one | one | Works1 | one |
| one | two | Jobs2 | one |
| one | 3 | Jobs3 | two |
| one | 3 | Jobs4 | one |
| one | 4 | Jobs5 | one |
Output I got
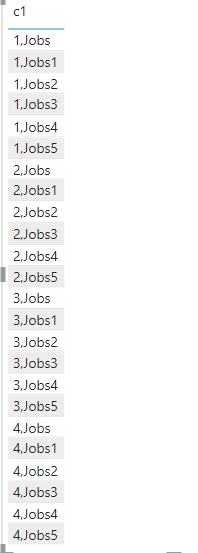
In the above image there is a column with the cross join and concatenation of Test2 and Test3, My requirement is to add 2 more columns with the concatenation of Test1 and Test2 and the concatenation of Test3 and Test4
Thank you
If you


