- Power BI forums
- Updates
- News & Announcements
- Get Help with Power BI
- Desktop
- Service
- Report Server
- Power Query
- Mobile Apps
- Developer
- DAX Commands and Tips
- Custom Visuals Development Discussion
- Health and Life Sciences
- Power BI Spanish forums
- Translated Spanish Desktop
- Power Platform Integration - Better Together!
- Power Platform Integrations (Read-only)
- Power Platform and Dynamics 365 Integrations (Read-only)
- Training and Consulting
- Instructor Led Training
- Dashboard in a Day for Women, by Women
- Galleries
- Community Connections & How-To Videos
- COVID-19 Data Stories Gallery
- Themes Gallery
- Data Stories Gallery
- R Script Showcase
- Webinars and Video Gallery
- Quick Measures Gallery
- 2021 MSBizAppsSummit Gallery
- 2020 MSBizAppsSummit Gallery
- 2019 MSBizAppsSummit Gallery
- Events
- Ideas
- Custom Visuals Ideas
- Issues
- Issues
- Events
- Upcoming Events
- Community Blog
- Power BI Community Blog
- Custom Visuals Community Blog
- Community Support
- Community Accounts & Registration
- Using the Community
- Community Feedback
Register now to learn Fabric in free live sessions led by the best Microsoft experts. From Apr 16 to May 9, in English and Spanish.
- Power BI forums
- Forums
- Get Help with Power BI
- Desktop
- Show values from parent category when child select...
- Subscribe to RSS Feed
- Mark Topic as New
- Mark Topic as Read
- Float this Topic for Current User
- Bookmark
- Subscribe
- Printer Friendly Page
- Mark as New
- Bookmark
- Subscribe
- Mute
- Subscribe to RSS Feed
- Permalink
- Report Inappropriate Content
Show values from parent category when child selected
I have student-level data from course evaluations for courses, and I want to be able to compare those ratings (on multiple factors) for a single course to the average ratings from various categories of courses, namely to:
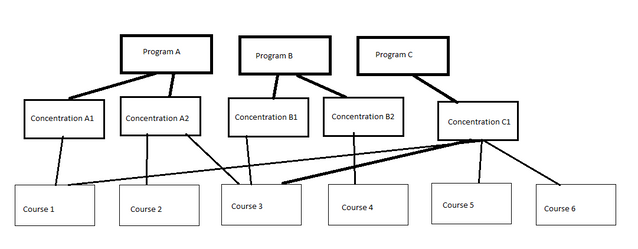
1. the average ratings of the concentration to which the course belongs
2. the average ratings of the program to which the concentration belongs.
Courses can be homed within more than one of the parent categories, something like this:
What I want:
When a user selects a program and a course from slicers, a bar graph shows the ratings from that course, and the averages for the relevant comparison categories are automatically displayed (either on the same graph or on separate ones), without the user having to select the concentration (because they often don't know to which concentration(s) a course belongs).
What is the best way to accomplish this?
Currently, I have:
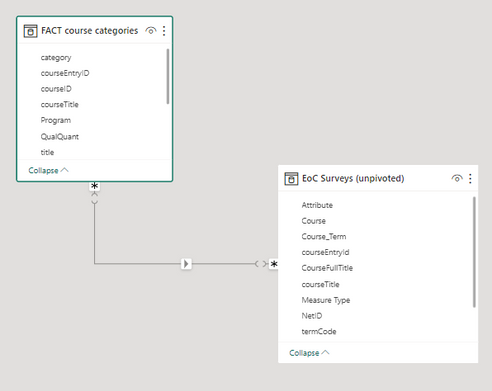
- a fact table that has one row for each course/concentation/program combination, so that each course can potentially have more than one row, if it belongs to more than one category
- an unpivoted data table with a column for value (ratings) and one for attribute (the survey questions), with a row being a student/course/semester/survey question
I also have slicers for course, concentration, and program, and this works *okay* but runs into the classic problem of returning blank visuals when the user changes a course without changing its relevant category (because the previous item remains selected).
Is there a better way to model my data to accomplish my goal? Or a DAX trick to make one visual show the other members in a parent category when the child is selected?
- Mark as New
- Bookmark
- Subscribe
- Mute
- Subscribe to RSS Feed
- Permalink
- Report Inappropriate Content
Hi @Krista,
According to your description, I'd like to suggest you create an unconnected table as source of slicer.
Then you can write a measure formula to extract the parent level field value and use it as condition to compare with current row context and return flag.
After these steps, you can use it on 'visual level filter' to filter records based on the filter with child level values.
Regards,
Xiaoxin Sheng
If this post helps, please consider accept as solution to help other members find it more quickly.
- Mark as New
- Bookmark
- Subscribe
- Mute
- Subscribe to RSS Feed
- Permalink
- Report Inappropriate Content
Thanks for your reply, Xiaoxin!
Do you have an example of what the Dax for that measure would look like? I think that is exactly the point where I'm getting stuck - how to extract the parent value.
Thanks,
Krista
- Mark as New
- Bookmark
- Subscribe
- Mute
- Subscribe to RSS Feed
- Permalink
- Report Inappropriate Content
Hi @Krista ,
Can you please share a pbix or some dummy data that keep the raw data structure with expected results? It should help us clarify your scenario and test to coding formula.
How to Get Your Question Answered Quickly
Regards,
Xiaoxin Sheng
If this post helps, please consider accept as solution to help other members find it more quickly.
Helpful resources

Microsoft Fabric Learn Together
Covering the world! 9:00-10:30 AM Sydney, 4:00-5:30 PM CET (Paris/Berlin), 7:00-8:30 PM Mexico City

Power BI Monthly Update - April 2024
Check out the April 2024 Power BI update to learn about new features.

| User | Count |
|---|---|
| 106 | |
| 98 | |
| 75 | |
| 63 | |
| 62 |
| User | Count |
|---|---|
| 135 | |
| 105 | |
| 104 | |
| 80 | |
| 65 |


