- Power BI forums
- Updates
- News & Announcements
- Get Help with Power BI
- Desktop
- Service
- Report Server
- Power Query
- Mobile Apps
- Developer
- DAX Commands and Tips
- Custom Visuals Development Discussion
- Health and Life Sciences
- Power BI Spanish forums
- Translated Spanish Desktop
- Power Platform Integration - Better Together!
- Power Platform Integrations (Read-only)
- Power Platform and Dynamics 365 Integrations (Read-only)
- Training and Consulting
- Instructor Led Training
- Dashboard in a Day for Women, by Women
- Galleries
- Community Connections & How-To Videos
- COVID-19 Data Stories Gallery
- Themes Gallery
- Data Stories Gallery
- R Script Showcase
- Webinars and Video Gallery
- Quick Measures Gallery
- 2021 MSBizAppsSummit Gallery
- 2020 MSBizAppsSummit Gallery
- 2019 MSBizAppsSummit Gallery
- Events
- Ideas
- Custom Visuals Ideas
- Issues
- Issues
- Events
- Upcoming Events
- Community Blog
- Power BI Community Blog
- Custom Visuals Community Blog
- Community Support
- Community Accounts & Registration
- Using the Community
- Community Feedback
Register now to learn Fabric in free live sessions led by the best Microsoft experts. From Apr 16 to May 9, in English and Spanish.
- Power BI forums
- Forums
- Get Help with Power BI
- Desktop
- Show lines in a line chart for intervals where the...
- Subscribe to RSS Feed
- Mark Topic as New
- Mark Topic as Read
- Float this Topic for Current User
- Bookmark
- Subscribe
- Printer Friendly Page
- Mark as New
- Bookmark
- Subscribe
- Mute
- Subscribe to RSS Feed
- Permalink
- Report Inappropriate Content
Show lines in a line chart for intervals where the values of both measures as known
Dear concerned
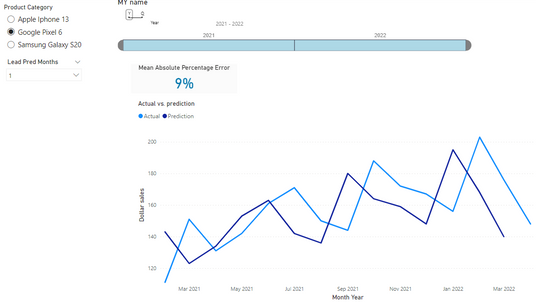
I have a line chart displaying two measures each belonging from a different table. There is a lead slicer that applies to one measure. Applying a lead of 2 means that there are 2 time intervals where one measure has null values, and the other measure has values. I would want to display the values in intervals only where the values of both measures as known. I am using the two measures to calculate MAPE. Ideally I would want to calculate MAPE for only intervals having values in both of the measures.
My canvas looks as follows:
You can see that for April, we have the data for actual but not for prediction. Hence ideally I would want the Actual data to only appear till March (i.e. months for which prediction data is also available)
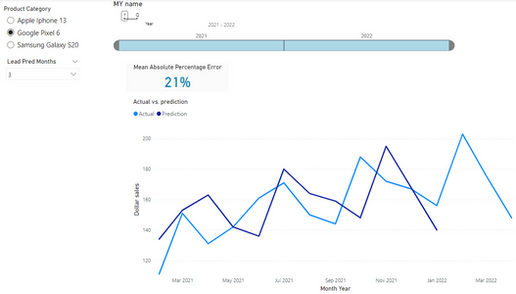
If I apply the lead of 3 on prediction, then it looks as follows:
In this case, data for Actual should appear uptill Jan'22.
Moreover with the current setting, MAPE in the scorecard is calculated incorrectly. Considering the first case, while calculating MAPE, it is taking the sum of actual for 14 intervals whereas taking the sum of 13 intervals for predictions. Whereas ideally it should only sum for intervals in which the value of both measures is known.
Solved! Go to Solution.
- Mark as New
- Bookmark
- Subscribe
- Mute
- Subscribe to RSS Feed
- Permalink
- Report Inappropriate Content
Hi,
as you have not provided any sample data, dax code or sample file, I can only show you a generic suggestion on how to solve your issue.
You can write the [Actual]-measure something like this, assuming you have a date table:
MeasureSales =
VAR _dates =
    CALCULATETABLE (
        VALUES ( Dates[Month] ),
        FILTER ( ALL ( Dates ), NOT ISEMPTY ( 'Predictions' ) )
    )
VAR _currentMonth =
    CALCULATE ( SELECTEDVALUE ( Dates[Month] ) )
RETURN
    IF ( _currentMonth IN _dates, SUM ( 'Actuals'[Actual] ), BLANK () )
Cheers,
Sturla
If this post helps, then please consider Accepting it as the solution. Kudos are nice too.
- Mark as New
- Bookmark
- Subscribe
- Mute
- Subscribe to RSS Feed
- Permalink
- Report Inappropriate Content
Hi @danisharoon ,
Please try this expression to calculate the actual.
Actuall =
VAR _sum =
    SUMMARIZE (
        'fact_actual',
        [MY name],
        "act",
            CALCULATE (
                SUM ( fact_actual[Actual] ),
                FILTER ( dim_my, NOT ISEMPTY ( fact_pred ) )
            )
    )
RETURN
    SUMX ( _sum, [act] )
And the MAPE:
Measure MAPE = DIVIDE (ABS(fact_actual[Actuall] - fact_pred[Total Pred]), fact_actual[Actuall], 0) Result:
Modified Pbix in the end you can refer.
Best Regards
Community Support Team _ chenwu zhu
If this post helps, then please consider Accept it as the solution to help the other members find it more quickly.
- Mark as New
- Bookmark
- Subscribe
- Mute
- Subscribe to RSS Feed
- Permalink
- Report Inappropriate Content
Hello there!
Thank you for the help. This did solve the problem in terms of the line chart, however the problem still remains while calculating the MAPE measure.
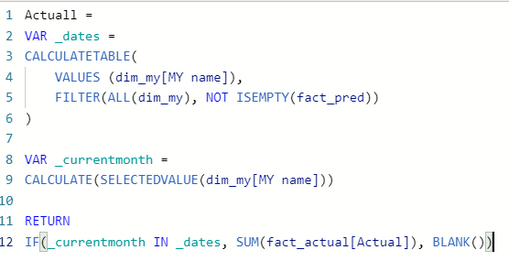
So, as recommended, I created a new measure as follows:
However I am unable to use this newly created measure while creating another measure.
Danish
- Mark as New
- Bookmark
- Subscribe
- Mute
- Subscribe to RSS Feed
- Permalink
- Report Inappropriate Content
If you want assistance with the measures, please provide the code for them, or share a sample pbix-file
- Mark as New
- Bookmark
- Subscribe
- Mute
- Subscribe to RSS Feed
- Permalink
- Report Inappropriate Content
Hi @sturlaws
Link to the pbix file is as follows:
The issue is coming in the Total Actuall measure of the fact_actual table
- Mark as New
- Bookmark
- Subscribe
- Mute
- Subscribe to RSS Feed
- Permalink
- Report Inappropriate Content
Hi @danisharoon ,
Please try this expression to calculate the actual.
Actuall =
VAR _sum =
    SUMMARIZE (
        'fact_actual',
        [MY name],
        "act",
            CALCULATE (
                SUM ( fact_actual[Actual] ),
                FILTER ( dim_my, NOT ISEMPTY ( fact_pred ) )
            )
    )
RETURN
    SUMX ( _sum, [act] )
And the MAPE:
Measure MAPE = DIVIDE (ABS(fact_actual[Actuall] - fact_pred[Total Pred]), fact_actual[Actuall], 0) Result:
Modified Pbix in the end you can refer.
Best Regards
Community Support Team _ chenwu zhu
If this post helps, then please consider Accept it as the solution to help the other members find it more quickly.
- Mark as New
- Bookmark
- Subscribe
- Mute
- Subscribe to RSS Feed
- Permalink
- Report Inappropriate Content
Hi,
as you have not provided any sample data, dax code or sample file, I can only show you a generic suggestion on how to solve your issue.
You can write the [Actual]-measure something like this, assuming you have a date table:
MeasureSales =
VAR _dates =
    CALCULATETABLE (
        VALUES ( Dates[Month] ),
        FILTER ( ALL ( Dates ), NOT ISEMPTY ( 'Predictions' ) )
    )
VAR _currentMonth =
    CALCULATE ( SELECTEDVALUE ( Dates[Month] ) )
RETURN
    IF ( _currentMonth IN _dates, SUM ( 'Actuals'[Actual] ), BLANK () )
Cheers,
Sturla
If this post helps, then please consider Accepting it as the solution. Kudos are nice too.
Helpful resources

Microsoft Fabric Learn Together
Covering the world! 9:00-10:30 AM Sydney, 4:00-5:30 PM CET (Paris/Berlin), 7:00-8:30 PM Mexico City

Power BI Monthly Update - April 2024
Check out the April 2024 Power BI update to learn about new features.

| User | Count |
|---|---|
| 106 | |
| 104 | |
| 77 | |
| 68 | |
| 61 |
| User | Count |
|---|---|
| 148 | |
| 107 | |
| 106 | |
| 82 | |
| 70 |


