Jumpstart your career with the Fabric Career Hub
Find everything you need to get certified on Fabric—skills challenges, live sessions, exam prep, role guidance, and a 50 percent discount on exams.
Get started- Power BI forums
- Updates
- News & Announcements
- Get Help with Power BI
- Desktop
- Service
- Report Server
- Power Query
- Mobile Apps
- Developer
- DAX Commands and Tips
- Custom Visuals Development Discussion
- Health and Life Sciences
- Power BI Spanish forums
- Translated Spanish Desktop
- Power Platform Integration - Better Together!
- Power Platform Integrations (Read-only)
- Power Platform and Dynamics 365 Integrations (Read-only)
- Training and Consulting
- Instructor Led Training
- Dashboard in a Day for Women, by Women
- Galleries
- Community Connections & How-To Videos
- COVID-19 Data Stories Gallery
- Themes Gallery
- Data Stories Gallery
- R Script Showcase
- Webinars and Video Gallery
- Quick Measures Gallery
- 2021 MSBizAppsSummit Gallery
- 2020 MSBizAppsSummit Gallery
- 2019 MSBizAppsSummit Gallery
- Events
- Ideas
- Custom Visuals Ideas
- Issues
- Issues
- Events
- Upcoming Events
- Community Blog
- Power BI Community Blog
- Custom Visuals Community Blog
- Community Support
- Community Accounts & Registration
- Using the Community
- Community Feedback
Earn a 50% discount on the DP-600 certification exam by completing the Fabric 30 Days to Learn It challenge.
- Power BI forums
- Forums
- Get Help with Power BI
- Desktop
- Scatter Plot
- Subscribe to RSS Feed
- Mark Topic as New
- Mark Topic as Read
- Float this Topic for Current User
- Bookmark
- Subscribe
- Printer Friendly Page
- Mark as New
- Bookmark
- Subscribe
- Mute
- Subscribe to RSS Feed
- Permalink
- Report Inappropriate Content
Scatter Plot
Hello,
Here I have pasted the Excel Scatter Plot
Similarly can i Create the same kind of visual in Power BI with average of two different fiels in X-axis,
I tried creating this but getting this error
Is there any other way or any plot to achieve same as the Excel one I pasted!!
Any Suggestions on this
Thanks in Advance!!!
- Mark as New
- Bookmark
- Subscribe
- Mute
- Subscribe to RSS Feed
- Permalink
- Report Inappropriate Content
@Kishore_Sr4 According to the error, you need to set "don't summarise" for X . If it doesn't work then create a new index column, and drag it to the value. Both ways work.
- Mark as New
- Bookmark
- Subscribe
- Mute
- Subscribe to RSS Feed
- Permalink
- Report Inappropriate Content
Hi @Kishore_Sr4 ,
I would need more details on what you are trying to achieve in Power BI:
https://community.powerbi.com/t5/Desktop/How-to-Get-Your-Question-Answered-Quickly/m-p/1447523
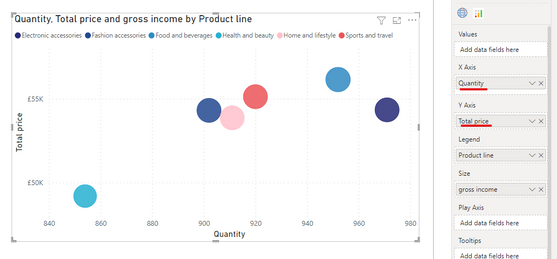
You can definitely create a scatter chart in Power BI. Something shown below:
- Mark as New
- Bookmark
- Subscribe
- Mute
- Subscribe to RSS Feed
- Permalink
- Report Inappropriate Content
Hi @Pragati11
I am trying to achieve what I have in my Excel plot, that is average value of two different fields has to be shown in same axis
In Power BI I have tried to put two different fields in X-axis but it is arriving at one single Marker point since I want to differentiate two different values
- Mark as New
- Bookmark
- Subscribe
- Mute
- Subscribe to RSS Feed
- Permalink
- Report Inappropriate Content
Helpful resources
| User | Count |
|---|---|
| 90 | |
| 74 | |
| 67 | |
| 63 | |
| 55 |
| User | Count |
|---|---|
| 101 | |
| 92 | |
| 74 | |
| 60 | |
| 59 |


