Thanks that post helped me fix it. Using the formula in the post I got this:
Measure = DIVIDE(
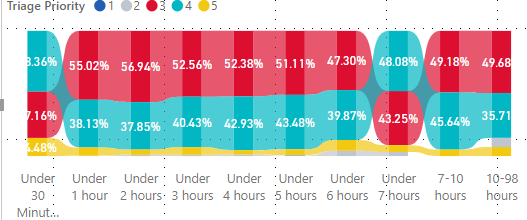
SUM('Generic ED Data'[POPULATION]),
CALCULATE(SUM('Generic ED Data'[POPULATION]),ALLSELECTED('Generic ED Data','Generic ED Data'[Priority])))However, this created a stacked column chart, which, whilst useful isn't exactly what I wanted.
I then used the following formula:
Measure 2= DIVIDE(
SUM('Generic ED Data'[POPULATION]),
CALCULATE(SUM('Generic ED Data'[POPULATION]),ALLEXCEPT('Generic ED Data','Generic ED Data'[Priority])))
which got me the result I wanted. Using ALLEXCEPT on timing showed which priority group had the most people leaving. The other method just showed a % for each axis point as well. Which is useful if I want to see which proportion of the priority group left for each time.


