- Power BI forums
- Updates
- News & Announcements
- Get Help with Power BI
- Desktop
- Service
- Report Server
- Power Query
- Mobile Apps
- Developer
- DAX Commands and Tips
- Custom Visuals Development Discussion
- Health and Life Sciences
- Power BI Spanish forums
- Translated Spanish Desktop
- Power Platform Integration - Better Together!
- Power Platform Integrations (Read-only)
- Power Platform and Dynamics 365 Integrations (Read-only)
- Training and Consulting
- Instructor Led Training
- Dashboard in a Day for Women, by Women
- Galleries
- Community Connections & How-To Videos
- COVID-19 Data Stories Gallery
- Themes Gallery
- Data Stories Gallery
- R Script Showcase
- Webinars and Video Gallery
- Quick Measures Gallery
- 2021 MSBizAppsSummit Gallery
- 2020 MSBizAppsSummit Gallery
- 2019 MSBizAppsSummit Gallery
- Events
- Ideas
- Custom Visuals Ideas
- Issues
- Issues
- Events
- Upcoming Events
- Community Blog
- Power BI Community Blog
- Custom Visuals Community Blog
- Community Support
- Community Accounts & Registration
- Using the Community
- Community Feedback
Register now to learn Fabric in free live sessions led by the best Microsoft experts. From Apr 16 to May 9, in English and Spanish.
- Power BI forums
- Forums
- Get Help with Power BI
- Desktop
- Power M Query custom aggregate function to return ...
- Subscribe to RSS Feed
- Mark Topic as New
- Mark Topic as Read
- Float this Topic for Current User
- Bookmark
- Subscribe
- Printer Friendly Page
- Mark as New
- Bookmark
- Subscribe
- Mute
- Subscribe to RSS Feed
- Permalink
- Report Inappropriate Content
Power M Query custom aggregate function to return most common value within a group
Can anyone help me? To come up with a custom aggregate function to return the most common value for one or more columns for a set of records which have a unique grouping: ie that you can use where you might use MAX, MIN etc but the result is the most commonly occuring value.
eg if grouping on col G1 and aggregating on cols A1 and A2 with the first table as input data you would get the 2nd table as output (happy to reformat tables if someone can point to how):
G1 A1 A2
a V1 V1
a V2 V1
a V2 V2
b V1 V1
b V2 V1
G1 A1 A2
a V2 V1
b V1 V1
Must be Power M Query - not DAX
And I guess formula to put in the Table.Group parameters would be OK rather than a neat custom function.
Something which looks at the resulting list of values, gets the distinct values, then counts occurences, sorts Hi-Lo and returns the first value. But I can't get my head around that.
Mike
Solved! Go to Solution.
- Mark as New
- Bookmark
- Subscribe
- Mute
- Subscribe to RSS Feed
- Permalink
- Report Inappropriate Content
Here is the answer I came up with. I have never written a Power M Query function definition so all feedback on style and performance welcome.
I think it is a useful function for when your data is mostly correct but you need to take the common value.
The logic of the function is:
- get the unique values and convert to table
- find number of times each occurs in the input
- Sort by descending and return the string in the first row - the most commonly occuring string
I could add something for how nulls are handled (eg ignore null if top string and return next one down) but this seems to work for me
Function is MostCommon (you have to name the query)
let
fnMostCommon = (ListIn)  =>
let
uniquevalues=List.Distinct(ListIn),
result=Table.FromList(uniquevalues,null,{"u"}),
result2=Table.AddColumn(result ,"freq", each List.Count(List.PositionOf(ListIn, [u], 100))),
result3 = Table.Sort(result2,{"freq", Order.Descending}),
result4 = List.First(result3[u])
in result4
in fnMostCommon
And the test harness is:
let
    Source = Table.FromRows(Json.Document(Binary.Decompress(Binary.FromText("i45WSlTSUQozhBCxOlC+ETa+EZifhKY+CVl9LAA=", BinaryEncoding.Base64), Compression.Deflate)), let _t = ((type text) meta [Serialized.Text = true]) in type table [G1 = _t, A1 = _t, A2 = _t]),
    #"Changed Type" = Table.TransformColumnTypes(Source,{{"G1", type text}, {"A1", type text}, {"A2", type text}}),
    #"Grouped Rows" = Table.Group(#"Changed Type", {"G1"}, {{"Agg", each MostCommon([A1]), type text}, {"Agg2", each AllConcat([A1]), type text}}),
    a = #"Grouped Rows"{[G1="a"]}[Agg]
in
    a
- Mark as New
- Bookmark
- Subscribe
- Mute
- Subscribe to RSS Feed
- Permalink
- Report Inappropriate Content
Hi @mikecrobp ,
I created a sample. Maybe it helps a little. Please have a try.
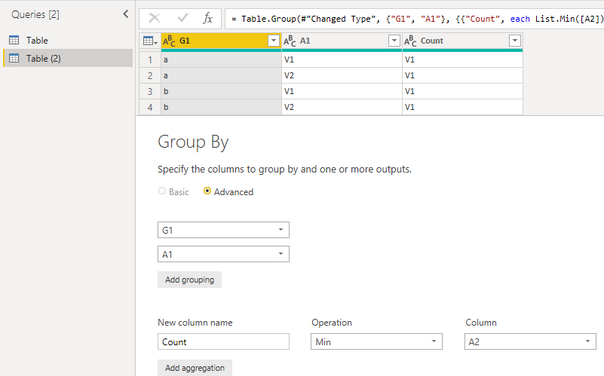
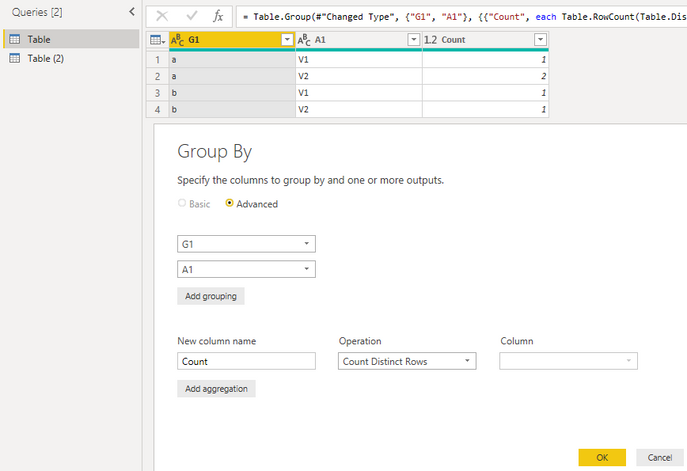
- Duplicate orginal table as Table(2) and group by it.
- Group by columns of Table.
- Merge two tables and append the new column
- Remove "Count" column and rows.
Table:
let
    Source = Table.FromRows(Json.Document(Binary.Decompress(Binary.FromText("i45WSlTSUQozhBCxOlC+ETa+EZifhKY+CVl9LAA=", BinaryEncoding.Base64), Compression.Deflate)), let _t = ((type text) meta [Serialized.Text = true]) in type table [G1 = _t, A1 = _t, A2 = _t]),
    #"Changed Type" = Table.TransformColumnTypes(Source,{{"G1", type text}, {"A1", type text}, {"A2", type text}}),
    #"Grouped Rows" = Table.Group(#"Changed Type", {"G1", "A1"}, {{"Count", each Table.RowCount(Table.Distinct(_)), type number}}),
    #"Merged Queries" = Table.NestedJoin(#"Grouped Rows", {"G1"}, #"Table (2)", {"G1"}, "Table (2)", JoinKind.LeftOuter),
    #"Aggregated Table (2)" = Table.AggregateTableColumn(#"Merged Queries", "Table (2)", {{"Count", List.Min, "Min of Table (2).Count"}}),
    #"Removed Columns" = Table.RemoveColumns(#"Aggregated Table (2)",{"Count"}),
    #"Removed Top Rows" = Table.Skip(#"Removed Columns",1),
    #"Removed Bottom Rows" = Table.RemoveLastN(#"Removed Top Rows",1)
in
    #"Removed Bottom Rows"
Table(2):
let
    Source = Table.FromRows(Json.Document(Binary.Decompress(Binary.FromText("i45WSlTSUQozhBCxOlC+ETa+EZifhKY+CVl9LAA=", BinaryEncoding.Base64), Compression.Deflate)), let _t = ((type text) meta [Serialized.Text = true]) in type table [G1 = _t, A1 = _t, A2 = _t]),
    #"Changed Type" = Table.TransformColumnTypes(Source,{{"G1", type text}, {"A1", type text}, {"A2", type text}}),
    #"Grouped Rows" = Table.Group(#"Changed Type", {"G1", "A1"}, {{"Count", each List.Min([A2]), type text}})
in
    #"Grouped Rows"
Best Regards,
Xue Ding
If this post helps, then please consider Accept it as the solution to help the other members find it more quickly. Kudos are nice too.
Xue Ding
If this post helps, then please consider Accept it as the solution to help the other members find it more quickly.
- Mark as New
- Bookmark
- Subscribe
- Mute
- Subscribe to RSS Feed
- Permalink
- Report Inappropriate Content
Thank you Xue Ding. of course that is how I should have presented the problem - with code using Table.FromRows!
My apologies - I should have said that I been using the technique of creating a new table and merging it back in.
Based on a post in stack overflow: Select row with MAX value per category Power BI
I wanted to create a new aggregate function because:
1 - it will be easy to read on the code. It will just appear with the standard aggregate functions like MAX, SUM etc
2 - To see if it ran any faster
3 - it will reduce the number of queries, for clarity
Writing the question yesterday has helped me think about the problem and I will write something based on your test data Mike
- Mark as New
- Bookmark
- Subscribe
- Mute
- Subscribe to RSS Feed
- Permalink
- Report Inappropriate Content
Here is the answer I came up with. I have never written a Power M Query function definition so all feedback on style and performance welcome.
I think it is a useful function for when your data is mostly correct but you need to take the common value.
The logic of the function is:
- get the unique values and convert to table
- find number of times each occurs in the input
- Sort by descending and return the string in the first row - the most commonly occuring string
I could add something for how nulls are handled (eg ignore null if top string and return next one down) but this seems to work for me
Function is MostCommon (you have to name the query)
let
fnMostCommon = (ListIn)  =>
let
uniquevalues=List.Distinct(ListIn),
result=Table.FromList(uniquevalues,null,{"u"}),
result2=Table.AddColumn(result ,"freq", each List.Count(List.PositionOf(ListIn, [u], 100))),
result3 = Table.Sort(result2,{"freq", Order.Descending}),
result4 = List.First(result3[u])
in result4
in fnMostCommon
And the test harness is:
let
    Source = Table.FromRows(Json.Document(Binary.Decompress(Binary.FromText("i45WSlTSUQozhBCxOlC+ETa+EZifhKY+CVl9LAA=", BinaryEncoding.Base64), Compression.Deflate)), let _t = ((type text) meta [Serialized.Text = true]) in type table [G1 = _t, A1 = _t, A2 = _t]),
    #"Changed Type" = Table.TransformColumnTypes(Source,{{"G1", type text}, {"A1", type text}, {"A2", type text}}),
    #"Grouped Rows" = Table.Group(#"Changed Type", {"G1"}, {{"Agg", each MostCommon([A1]), type text}, {"Agg2", each AllConcat([A1]), type text}}),
    a = #"Grouped Rows"{[G1="a"]}[Agg]
in
    a
Helpful resources

Microsoft Fabric Learn Together
Covering the world! 9:00-10:30 AM Sydney, 4:00-5:30 PM CET (Paris/Berlin), 7:00-8:30 PM Mexico City

Power BI Monthly Update - April 2024
Check out the April 2024 Power BI update to learn about new features.

| User | Count |
|---|---|
| 97 | |
| 96 | |
| 82 | |
| 74 | |
| 66 |
| User | Count |
|---|---|
| 121 | |
| 105 | |
| 102 | |
| 82 | |
| 72 |


