- Power BI forums
- Updates
- News & Announcements
- Get Help with Power BI
- Desktop
- Service
- Report Server
- Power Query
- Mobile Apps
- Developer
- DAX Commands and Tips
- Custom Visuals Development Discussion
- Health and Life Sciences
- Power BI Spanish forums
- Translated Spanish Desktop
- Power Platform Integration - Better Together!
- Power Platform Integrations (Read-only)
- Power Platform and Dynamics 365 Integrations (Read-only)
- Training and Consulting
- Instructor Led Training
- Dashboard in a Day for Women, by Women
- Galleries
- Community Connections & How-To Videos
- COVID-19 Data Stories Gallery
- Themes Gallery
- Data Stories Gallery
- R Script Showcase
- Webinars and Video Gallery
- Quick Measures Gallery
- 2021 MSBizAppsSummit Gallery
- 2020 MSBizAppsSummit Gallery
- 2019 MSBizAppsSummit Gallery
- Events
- Ideas
- Custom Visuals Ideas
- Issues
- Issues
- Events
- Upcoming Events
- Community Blog
- Power BI Community Blog
- Custom Visuals Community Blog
- Community Support
- Community Accounts & Registration
- Using the Community
- Community Feedback
Register now to learn Fabric in free live sessions led by the best Microsoft experts. From Apr 16 to May 9, in English and Spanish.
- Power BI forums
- Forums
- Get Help with Power BI
- Desktop
- Need help to create a fixed denominator to calcula...
- Subscribe to RSS Feed
- Mark Topic as New
- Mark Topic as Read
- Float this Topic for Current User
- Bookmark
- Subscribe
- Printer Friendly Page
- Mark as New
- Bookmark
- Subscribe
- Mute
- Subscribe to RSS Feed
- Permalink
- Report Inappropriate Content
Need help to create a fixed denominator to calculate %
Hi,
I have this data and this is how 1 enrollment looks like:
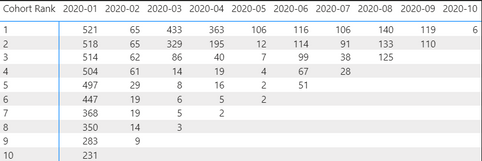
From this dataset, I created a chart with the absolute value like this. Basically, this is to see if all of the students join in 2020-01 stay with the learning center for how long and how many of them are left after a period of time. The Cohort Rank is the order of the month that the students are still staying with us.
What I am trying to do is to turn this into Percentage. But I really struggle with making the denominator to be fixed ( the first row). For example for Cohort 2020-01, I need all of the months after that to divide by 521. I tried to filter the Denominator with the Cohort rank =1 but I get nothing for the 2nd month afterward. So I only get 1st month 100% and infinity after that T.T
For example for 2020-01: I need the 1st month to be 100%, the 2nd month is 518/521 = 99% and 3rd month 514/521.
I really need help with this!!!
Thanks a lot and I really appreciate your help.
Solved! Go to Solution.
- Mark as New
- Bookmark
- Subscribe
- Mute
- Subscribe to RSS Feed
- Permalink
- Report Inappropriate Content
Hi @FrankAT,
My Numerator is actually not a column. I am trying to do a measure for this.
- Mark as New
- Bookmark
- Subscribe
- Mute
- Subscribe to RSS Feed
- Permalink
- Report Inappropriate Content
Hi @Anonymous ,
Try this:
Percent =
VAR Denominator =
    CALCULATE ( [Numerator], Cohort[Cohort Rank] = 1 )
RETURN
    DIVIDE ( [Numerator], Denominator )
Best Regards,
Icey
If this post helps, then please consider Accept it as the solution to help the other members find it more quickly.
- Mark as New
- Bookmark
- Subscribe
- Mute
- Subscribe to RSS Feed
- Permalink
- Report Inappropriate Content
Hi @Anonymous
with an excerpt of your sample data:
Percentage  to Cohort Rank 1 =
VAR _Denominator = CALCULATE(VALUES('Table'[2020-01]),'Table'[Cohort Rank] = 1)
RETURN
    DIVIDE(SUM('Table'[2020-01]),_Denominator)
With kind regards from the town where the legend of the 'Pied Piper of Hamelin' is at home
FrankAT (Proud to be a Datanaut)
- Mark as New
- Bookmark
- Subscribe
- Mute
- Subscribe to RSS Feed
- Permalink
- Report Inappropriate Content
Hi @FrankAT,
My Numerator is actually not a column. I am trying to do a measure for this.
Helpful resources

Microsoft Fabric Learn Together
Covering the world! 9:00-10:30 AM Sydney, 4:00-5:30 PM CET (Paris/Berlin), 7:00-8:30 PM Mexico City

Power BI Monthly Update - April 2024
Check out the April 2024 Power BI update to learn about new features.

| User | Count |
|---|---|
| 97 | |
| 95 | |
| 80 | |
| 77 | |
| 66 |
| User | Count |
|---|---|
| 129 | |
| 106 | |
| 106 | |
| 86 | |
| 72 |


