- Power BI forums
- Updates
- News & Announcements
- Get Help with Power BI
- Desktop
- Service
- Report Server
- Power Query
- Mobile Apps
- Developer
- DAX Commands and Tips
- Custom Visuals Development Discussion
- Health and Life Sciences
- Power BI Spanish forums
- Translated Spanish Desktop
- Power Platform Integration - Better Together!
- Power Platform Integrations (Read-only)
- Power Platform and Dynamics 365 Integrations (Read-only)
- Training and Consulting
- Instructor Led Training
- Dashboard in a Day for Women, by Women
- Galleries
- Community Connections & How-To Videos
- COVID-19 Data Stories Gallery
- Themes Gallery
- Data Stories Gallery
- R Script Showcase
- Webinars and Video Gallery
- Quick Measures Gallery
- 2021 MSBizAppsSummit Gallery
- 2020 MSBizAppsSummit Gallery
- 2019 MSBizAppsSummit Gallery
- Events
- Ideas
- Custom Visuals Ideas
- Issues
- Issues
- Events
- Upcoming Events
- Community Blog
- Power BI Community Blog
- Custom Visuals Community Blog
- Community Support
- Community Accounts & Registration
- Using the Community
- Community Feedback
Register now to learn Fabric in free live sessions led by the best Microsoft experts. From Apr 16 to May 9, in English and Spanish.
- Power BI forums
- Forums
- Get Help with Power BI
- Desktop
- Merge two table
- Subscribe to RSS Feed
- Mark Topic as New
- Mark Topic as Read
- Float this Topic for Current User
- Bookmark
- Subscribe
- Printer Friendly Page
- Mark as New
- Bookmark
- Subscribe
- Mute
- Subscribe to RSS Feed
- Permalink
- Report Inappropriate Content
Merge two table
Hello,
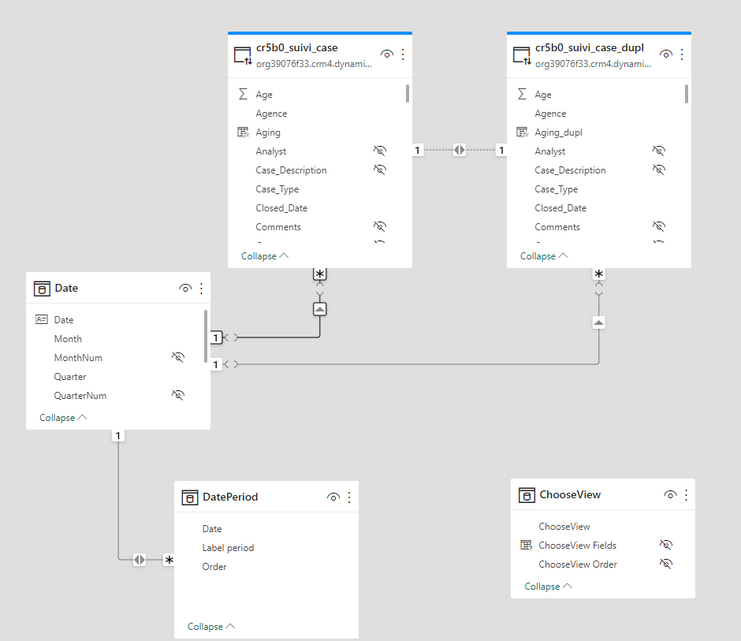
I have the following model view :
I have two table "suivi_case", "suivi_case_dupl" who is a duplication of "suivi_case" and a custom date table.
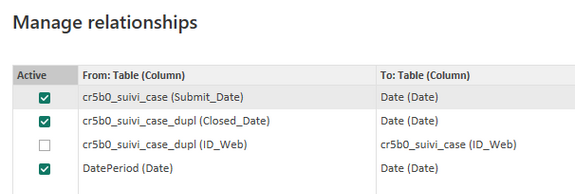
The "suivi_case" table is in direct relationship with the date table through the column "suivi_case[Sumbit_Date]" -> "Date[Date]"
The "suivi_case_dupl" table is in direct relationship with the date table through the column "suivi_case_dupl[Close_Date]" -> "Date[Date]"
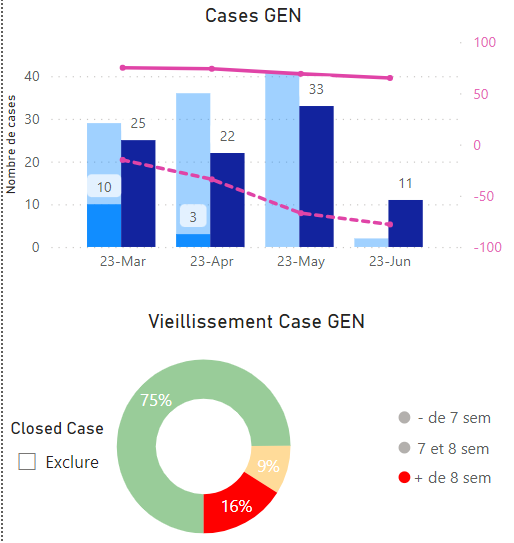
The model is in this way because I can't have two direct relationship between table (see: https://learn.microsoft.com/en-us/power-bi/guidance/relationships-active-inactive ) and I need it two display open/close hotline ticket bar chart:
In both table, "suivi_case" and "suivi_caset_dupl", I have a third column "Age" who contain the age in number of weeks of each ticket.
Now, I want to display in a pie chart the number/percentage of ticket split into three categories according to the following aging (calculated column) :
Aging = IF(cr5b0_suivi_case[Age] <= 6, " - de 7 wks", IF(cr5b0_suivi_case[Age] > 8, "+ de 8 wks", " 7 et 8 wks"))
I can easily display two pi charts, one for "suivi_case" and one for "suivi_case_dupl". But I want to have only one pie chart who will take data from both "suivi_case" and "suivi_case_dupl".
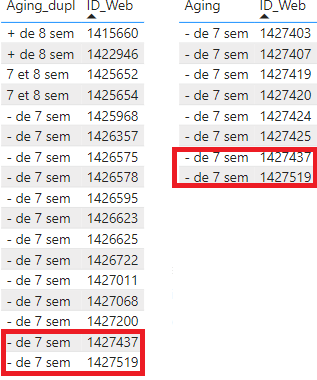
For example, I'm able to display with a table visual, (for a period of one week) the open tickets from "suivi_case" with their related aging.
In the same way, I'm displaying close tickets from "suivi_caset_dupl" with their related aging.
Now, how I can merge these two 'tables' ? We need to be careful that there is duplication of id when a ticket was open and close in the same selected period (in red rectangle on above picture), and we don't want to count a same ticket twice.
Thanks for your help,
Solved! Go to Solution.
- Mark as New
- Bookmark
- Subscribe
- Mute
- Subscribe to RSS Feed
- Permalink
- Report Inappropriate Content
@GMallory , No need to duplicate table, You can use inactive relationship and use userelationship in measure to use another join
One date Table - Two join - On inactive , assume CloseDate is inactive
calculate( Countrows(suivi_case),USERELATIONSHIP ('suivi_case'[CloseDate], 'Date'[Date]))
refer
Power BI: HR Analytics - Employees as on Date : https://youtu.be/e6Y-l_JtCq4
https://community.powerbi.com/t5/Community-Blog/HR-Analytics-Active-Employee-Hire-and-Termination-tr...
Microsoft Power BI Learning Resources, 2023 !!
Learn Power BI - Full Course with Dec-2022, with Window, Index, Offset, 100+ Topics !!
Did I answer your question? Mark my post as a solution! Appreciate your Kudos !! Proud to be a Super User! !!
- Mark as New
- Bookmark
- Subscribe
- Mute
- Subscribe to RSS Feed
- Permalink
- Report Inappropriate Content
Hello @amitchandak ,
Thanks for your quick answer.
With your advice, I was able to remove my duplicate table and create successfully my pie chart.
According to your message, I create a new measure :
calculate_close_date = calculate(Countrows(suivi_case), USERELATIONSHIP(suivi_case[Closed_Date], 'Date'[Date]))
After put it on column y-axis of my bar chart, it's work fine.
Then, to create my pie chart, I created a new column in my table :
Aging = IF(suivi_case[Age] <= 6, " - de 7 sem", IF(suivi_case[Age] > 8, "+ de 8 sem", " 7 et 8 sem"))
Finally, I create three new measure :
- 7 sem = calculate(Countrows(suivi_case), USERELATIONSHIP(suivi_case[Closed_Date], 'Date'[Date]), suivi_case[Age] < = 6 ) + calculate(Countrows(suivi_case), suivi_case[Age] < = 6 ) betw 7 & 8 sem = calculate(Countrows(suivi_case), USERELATIONSHIP(suivi_case[Closed_Date], 'Date'[Date]), suivi_case[Age] > 6 && suivi_case[Age] < = 8 ) + calculate(Countrows(suivi_case), suivi_case[Age] > 6 && suivi_case[Age] < = 8 ) + 8 sem = calculate(Countrows(suivi_case), USERELATIONSHIP(suivi_case[Closed_Date], 'Date'[Date]), suivi_case[Age] > 8 ) + calculate(Countrows(suivi_case), suivi_case[Age] > 8 )
In my pie chart, I place Aging column as Legend and the three measures as Values.
It's work really fine and data are correct.
However, I still face some issues.
When I want to interact with my pie chart with the highlighting functionality, it's work partially.
For example, if I select the red 16% in my bar chart, only open case change dynamically on my bar chart.
In the same way : I create a new column to set an "exclude closed case" slicer.
ExcludeClosed = IF(cr5b0_suivi_case[Status] <> "Closed", "Exclure", BLANK())
But when I check the slicer, the "open tickets" bars are updated, but nothing about "close tickets" bars (which should
disappear completely).
How I can fix these broken behaviors ?
Thanks a lot.
- Mark as New
- Bookmark
- Subscribe
- Mute
- Subscribe to RSS Feed
- Permalink
- Report Inappropriate Content
@amitchandakSorry, now all is working perfectly !
I don't know what I did, but I play a bit with the "edit interaction" tool, and now it's working fine.
Thank you very much !
- Mark as New
- Bookmark
- Subscribe
- Mute
- Subscribe to RSS Feed
- Permalink
- Report Inappropriate Content
@GMallory , No need to duplicate table, You can use inactive relationship and use userelationship in measure to use another join
One date Table - Two join - On inactive , assume CloseDate is inactive
calculate( Countrows(suivi_case),USERELATIONSHIP ('suivi_case'[CloseDate], 'Date'[Date]))
refer
Power BI: HR Analytics - Employees as on Date : https://youtu.be/e6Y-l_JtCq4
https://community.powerbi.com/t5/Community-Blog/HR-Analytics-Active-Employee-Hire-and-Termination-tr...
Microsoft Power BI Learning Resources, 2023 !!
Learn Power BI - Full Course with Dec-2022, with Window, Index, Offset, 100+ Topics !!
Did I answer your question? Mark my post as a solution! Appreciate your Kudos !! Proud to be a Super User! !!
Helpful resources

Microsoft Fabric Learn Together
Covering the world! 9:00-10:30 AM Sydney, 4:00-5:30 PM CET (Paris/Berlin), 7:00-8:30 PM Mexico City

Power BI Monthly Update - April 2024
Check out the April 2024 Power BI update to learn about new features.

| User | Count |
|---|---|
| 106 | |
| 104 | |
| 77 | |
| 68 | |
| 61 |
| User | Count |
|---|---|
| 148 | |
| 107 | |
| 107 | |
| 83 | |
| 70 |


