- Power BI forums
- Updates
- News & Announcements
- Get Help with Power BI
- Desktop
- Service
- Report Server
- Power Query
- Mobile Apps
- Developer
- DAX Commands and Tips
- Custom Visuals Development Discussion
- Health and Life Sciences
- Power BI Spanish forums
- Translated Spanish Desktop
- Power Platform Integration - Better Together!
- Power Platform Integrations (Read-only)
- Power Platform and Dynamics 365 Integrations (Read-only)
- Training and Consulting
- Instructor Led Training
- Dashboard in a Day for Women, by Women
- Galleries
- Community Connections & How-To Videos
- COVID-19 Data Stories Gallery
- Themes Gallery
- Data Stories Gallery
- R Script Showcase
- Webinars and Video Gallery
- Quick Measures Gallery
- 2021 MSBizAppsSummit Gallery
- 2020 MSBizAppsSummit Gallery
- 2019 MSBizAppsSummit Gallery
- Events
- Ideas
- Custom Visuals Ideas
- Issues
- Issues
- Events
- Upcoming Events
- Community Blog
- Power BI Community Blog
- Custom Visuals Community Blog
- Community Support
- Community Accounts & Registration
- Using the Community
- Community Feedback
Register now to learn Fabric in free live sessions led by the best Microsoft experts. From Apr 16 to May 9, in English and Spanish.
- Power BI forums
- Forums
- Get Help with Power BI
- Desktop
- Interaction Toolbar Missing for some Visualization...
- Subscribe to RSS Feed
- Mark Topic as New
- Mark Topic as Read
- Float this Topic for Current User
- Bookmark
- Subscribe
- Printer Friendly Page
- Mark as New
- Bookmark
- Subscribe
- Mute
- Subscribe to RSS Feed
- Permalink
- Report Inappropriate Content
Interaction Toolbar Missing for some Visualizations
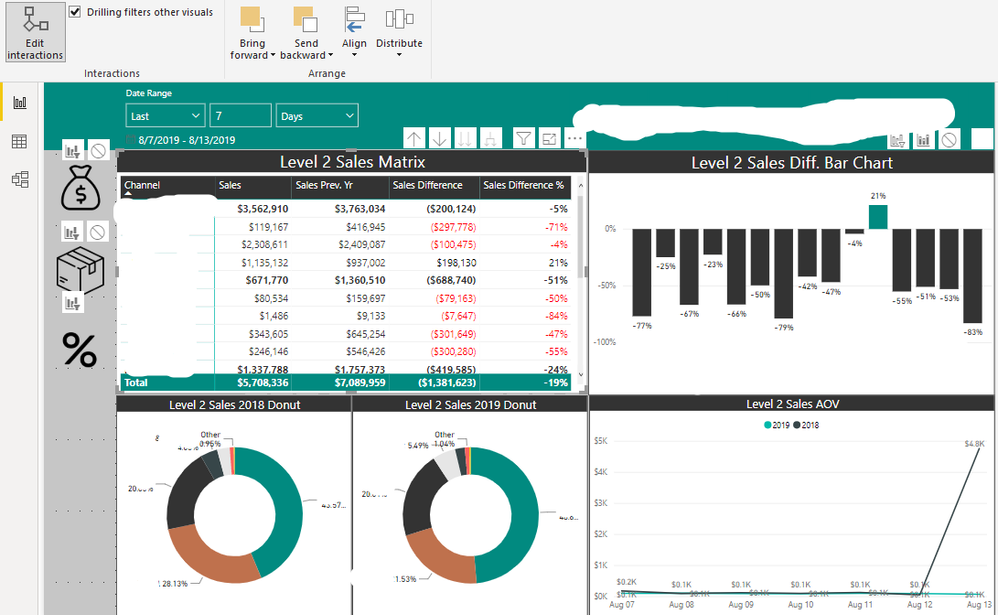
I am trying to edit how certain visualizations interact with each other but i've run into a snag. When i click on the "Level 2 Sales Matrix" visualization, some of the other visualizations like the bar chart next to it have the typical highlight, filter, or none options in the tool bar. The donuts though and the AOV line chart do not. Is there some property in those visualizations that I have accidentally turned on or off that prevent me from changing how they interact with others?
The donuts are stuck on highlight and i'd like them to filter instead, but the interaction toolbar is gone.
Solved! Go to Solution.
- Mark as New
- Bookmark
- Subscribe
- Mute
- Subscribe to RSS Feed
- Permalink
- Report Inappropriate Content
One possibility is that the matrix is on top of these toolbars and they are displaying underneath the green total bar. Have you tried click on one of the donut charts and clicking the "Bring to Front" option, then clicking back on the sales matrix?
- Mark as New
- Bookmark
- Subscribe
- Mute
- Subscribe to RSS Feed
- Permalink
- Report Inappropriate Content
@awitt ,
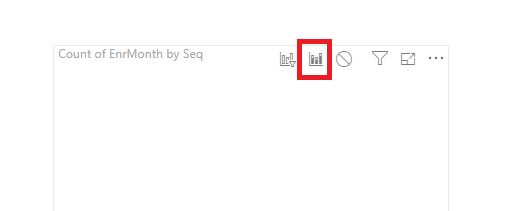
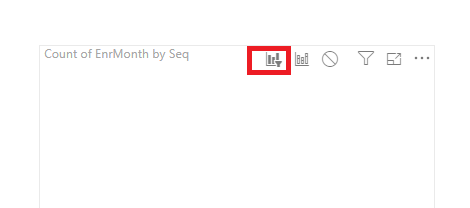
You may have selected the "highlight" icon like below:

Select the filter icon on the left hand.

Community Support Team _ Jimmy Tao
If this post helps, then please consider Accept it as the solution to help the other members find it more quickly.
- Mark as New
- Bookmark
- Subscribe
- Mute
- Subscribe to RSS Feed
- Permalink
- Report Inappropriate Content
No my point is that the icons are not available to select for certain visualizations. The default interaction is highlight but I'm trying to change it to filter - but the filter icon is not there, or the "none" icon.
- Mark as New
- Bookmark
- Subscribe
- Mute
- Subscribe to RSS Feed
- Permalink
- Report Inappropriate Content
So have you tried my solution of using the "Bring to front" action on the dout charts? (or even temporarily making the donut charts smaller so they are not so close to the visuals above)
- Mark as New
- Bookmark
- Subscribe
- Mute
- Subscribe to RSS Feed
- Permalink
- Report Inappropriate Content
One possibility is that the matrix is on top of these toolbars and they are displaying underneath the green total bar. Have you tried click on one of the donut charts and clicking the "Bring to Front" option, then clicking back on the sales matrix?
- Mark as New
- Bookmark
- Subscribe
- Mute
- Subscribe to RSS Feed
- Permalink
- Report Inappropriate Content
It doesn't seem to work on PBI desktop but when I did this on the webapp it did show up. Not sure why the desktop version of the report is still not showing - but it works where its published now. Thanks!
Helpful resources

Microsoft Fabric Learn Together
Covering the world! 9:00-10:30 AM Sydney, 4:00-5:30 PM CET (Paris/Berlin), 7:00-8:30 PM Mexico City

Power BI Monthly Update - April 2024
Check out the April 2024 Power BI update to learn about new features.

| User | Count |
|---|---|
| 106 | |
| 96 | |
| 79 | |
| 66 | |
| 62 |
| User | Count |
|---|---|
| 145 | |
| 113 | |
| 105 | |
| 85 | |
| 65 |

