- Power BI forums
- Updates
- News & Announcements
- Get Help with Power BI
- Desktop
- Service
- Report Server
- Power Query
- Mobile Apps
- Developer
- DAX Commands and Tips
- Custom Visuals Development Discussion
- Health and Life Sciences
- Power BI Spanish forums
- Translated Spanish Desktop
- Power Platform Integration - Better Together!
- Power Platform Integrations (Read-only)
- Power Platform and Dynamics 365 Integrations (Read-only)
- Training and Consulting
- Instructor Led Training
- Dashboard in a Day for Women, by Women
- Galleries
- Community Connections & How-To Videos
- COVID-19 Data Stories Gallery
- Themes Gallery
- Data Stories Gallery
- R Script Showcase
- Webinars and Video Gallery
- Quick Measures Gallery
- 2021 MSBizAppsSummit Gallery
- 2020 MSBizAppsSummit Gallery
- 2019 MSBizAppsSummit Gallery
- Events
- Ideas
- Custom Visuals Ideas
- Issues
- Issues
- Events
- Upcoming Events
- Community Blog
- Power BI Community Blog
- Custom Visuals Community Blog
- Community Support
- Community Accounts & Registration
- Using the Community
- Community Feedback
Register now to learn Fabric in free live sessions led by the best Microsoft experts. From Apr 16 to May 9, in English and Spanish.
- Power BI forums
- Forums
- Get Help with Power BI
- Desktop
- How to stop visual table from displaying duplicate...
- Subscribe to RSS Feed
- Mark Topic as New
- Mark Topic as Read
- Float this Topic for Current User
- Bookmark
- Subscribe
- Printer Friendly Page
- Mark as New
- Bookmark
- Subscribe
- Mute
- Subscribe to RSS Feed
- Permalink
- Report Inappropriate Content
How to stop visual table from displaying duplicate values when filtered (contains a measure)
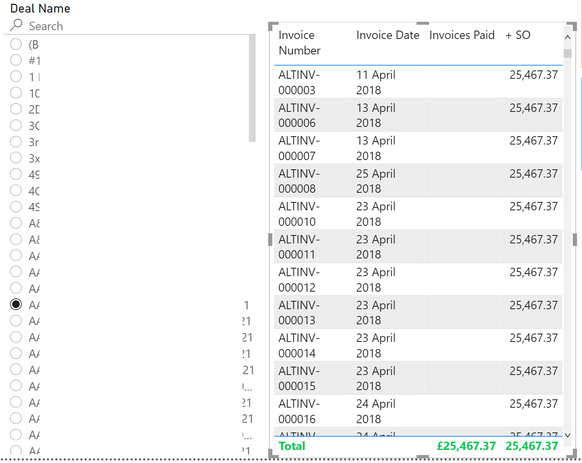
Hello there, I have an issue with an invoice table that shows every single invoice instead of the ones that are supposed to be filtered. This problem only occurs when I add the +SO column in the table (which is a measure). However, it shows the correct figure, so it is working.
So currently, when I select a Deal on the Deal Slicer, it is supposed to show all the invoices in that deal below I have an example of a random deal. Here is how it looks at the moment:
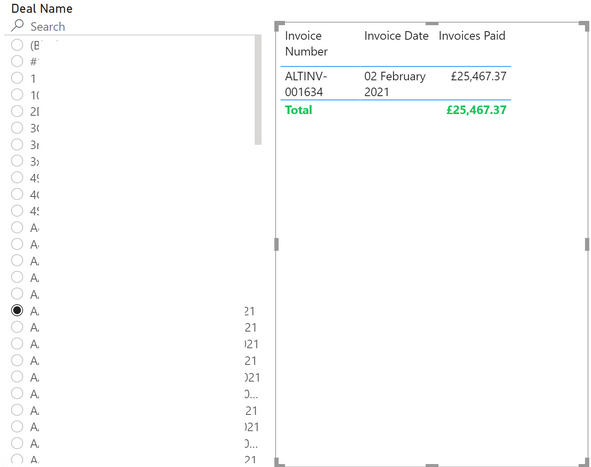
The figure is correct, however it's displaying this figure on every single invoice instead of showing the exact invoice (or invoices). However, when I take the measure column out (+ SO), it works as intended, correct figure, and correct invoice shown:
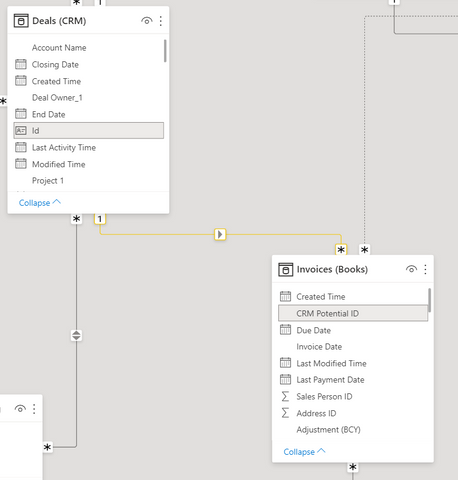
These figures are currently filtered from two different tables, "Deals (CRM)" table and "Invoices (CRM)" table, here is the relationship below:
Here is the relationship, just a simple one way, one to many. As a Deal can have one to many Invoices. The relationship is correct and it works fine.
But I think it's obvious the measure itself is doing this. The measure that is called "+ SO" is in the Deals (CRM) table, and it uses a column called "SO Cost Invoice", this isn't used all the time, but it's handy to have in for Invoices. But I don't understand why this measure would be causing the table to count and duplicate every single invoice the way it has? Here is the measure below incase people notice something off with it:
+ SO =
VAR _SOCostInvoice = [SO Cost Invoice]
VAR _InvoicesPaid = [Invoices Paid]
RETURN
if( isfiltered('Deals (CRM)'[Deal Name]) ,
SUMX (
VALUES ( 'Deals (CRM)'[Deal Name] ),
IF ( ISBLANK ( _SOCostInvoice ), _InvoicesPaid, _SOCostInvoice )
) , _InvoicesPaid )
All this does is check if a Deal already has a [SO Cost Invoice], if so it will trust that figure more than it will any of the invoices attached. Otherwise if it doesn't, it will use the [Invoice Paid] from the invoice table instead.
Let me know if you have any questions.
- Mark as New
- Bookmark
- Subscribe
- Mute
- Subscribe to RSS Feed
- Permalink
- Report Inappropriate Content
Hi, @Anonymous ;
There are many reasons for this and it is difficult to judge based on your information. Can you create a simple data (structure similar to your table) and share files or screenshots? In addition, could you please share the formulas of [Invoices] and [SO Cost Invoice]?
Best Regards,
Community Support Team_ Yalan Wu
If this post helps, then please consider Accept it as the solution to help the other members find it more quickly.
- Mark as New
- Bookmark
- Subscribe
- Mute
- Subscribe to RSS Feed
- Permalink
- Report Inappropriate Content
Hi @Anonymous , as I understood correctly, the two columns are from different table and you try to filter from the many side? Please first turn on bidirectional filtering in Data model and see if it solves your issue with "every row same amount".
If that is cleared I would recommend to use Related()-function to expand the one side of the 1:n relationship into your facttable. I cannot see how you calculated your other measures before you put it into the one you posted.
Best.
- Mark as New
- Bookmark
- Subscribe
- Mute
- Subscribe to RSS Feed
- Permalink
- Report Inappropriate Content
Hi @Applicable88 thanks for the response.
The Deals to Invoices isn't bi-directional so that shouldn't be an issue should it? Anyway I did turn off some of hte other bi-directional relationships and the problem was still there. I did make the Deals and Invoices bi-directional and it solved the problem. But I don't like bi-directional relationships because of ambiguity in the model, so I try my best to avoid them.
The other measures I believe you're referring to are the ones referenced in the + SO one? They're all in Deals also and they're simply just a sum of, counting the totals, that's it.
Helpful resources

Microsoft Fabric Learn Together
Covering the world! 9:00-10:30 AM Sydney, 4:00-5:30 PM CET (Paris/Berlin), 7:00-8:30 PM Mexico City

Power BI Monthly Update - April 2024
Check out the April 2024 Power BI update to learn about new features.

| User | Count |
|---|---|
| 107 | |
| 100 | |
| 85 | |
| 77 | |
| 66 |
| User | Count |
|---|---|
| 120 | |
| 112 | |
| 94 | |
| 84 | |
| 75 |


