- Power BI forums
- Updates
- News & Announcements
- Get Help with Power BI
- Desktop
- Service
- Report Server
- Power Query
- Mobile Apps
- Developer
- DAX Commands and Tips
- Custom Visuals Development Discussion
- Health and Life Sciences
- Power BI Spanish forums
- Translated Spanish Desktop
- Power Platform Integration - Better Together!
- Power Platform Integrations (Read-only)
- Power Platform and Dynamics 365 Integrations (Read-only)
- Training and Consulting
- Instructor Led Training
- Dashboard in a Day for Women, by Women
- Galleries
- Community Connections & How-To Videos
- COVID-19 Data Stories Gallery
- Themes Gallery
- Data Stories Gallery
- R Script Showcase
- Webinars and Video Gallery
- Quick Measures Gallery
- 2021 MSBizAppsSummit Gallery
- 2020 MSBizAppsSummit Gallery
- 2019 MSBizAppsSummit Gallery
- Events
- Ideas
- Custom Visuals Ideas
- Issues
- Issues
- Events
- Upcoming Events
- Community Blog
- Power BI Community Blog
- Custom Visuals Community Blog
- Community Support
- Community Accounts & Registration
- Using the Community
- Community Feedback
Register now to learn Fabric in free live sessions led by the best Microsoft experts. From Apr 16 to May 9, in English and Spanish.
- Power BI forums
- Forums
- Get Help with Power BI
- Desktop
- How to get same top 5 customers in different visua...
- Subscribe to RSS Feed
- Mark Topic as New
- Mark Topic as Read
- Float this Topic for Current User
- Bookmark
- Subscribe
- Printer Friendly Page
- Mark as New
- Bookmark
- Subscribe
- Mute
- Subscribe to RSS Feed
- Permalink
- Report Inappropriate Content
How to get same top 5 customers in different visual
Hi all
I will try to explain my problem easily to you.
I have two table as Data and Date.
Data Table:
| Customer | Dimension | KPI1 | KPI2 |
| .0110163785 | 08 | 0 | 0 |
| .0320053606 | 08 | 0 | 0 |
| 80854517 | 08 | 0 | 0 |
| 100183402 | 08 | 0 | 0 |
* dimension column using for date as text. It has weeks and months. Weeks are shown as 2 digits (01,02,52) and months are shown as 3 digits (01,02,12). You don't need to do anyting with this. I have already join it to my date table.
I was created two column on this table as No and Rank.
No = 1
Date Table:
| Index | ID | Dimension | Text |
| 1 | 01 | Weekly | W01 |
| 2 | 02 | Weekly | W02 |
| 53 | 001 | Monthly | January |
| 54 | 002 | Monthly | February |
this two tables are joined on ID and Dimension columns. You can check the full data set from pbix.
Lets talk about my situation.
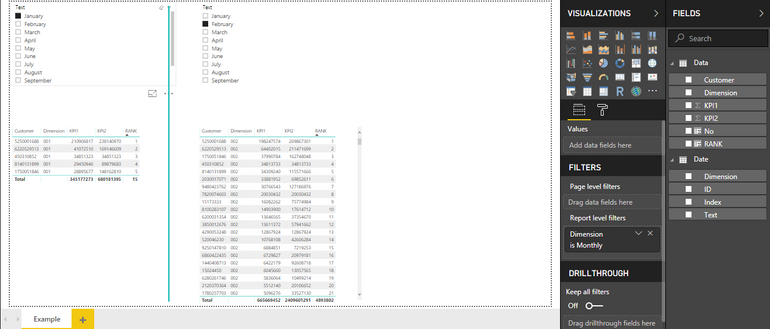
I added 2 date filter to page. Every date filter must be only filter the own below visual. Then when the first one selected it must be show the top 5 customers for their overdue values. I use the column to get top 5 which i have already created. (Rank)
Visual on the left side is okey for me. I want to transform to the right side visual. On the right graph, i want to show the top 5 overdue value according to the customers on the left. so, I would like to see the values of the 5 customers on the left according to the filter on the right
As an example; the graph on the right should look like this.
| Customer | Dimension | KPI1 | KPI2 |
| 5250001688 | 2 | 198247574 | 269867301 |
| 6220529513 | 2 | 64402015 | 211471699 |
| 450310852 | 2 | 34813733 | 34813733 |
| 8140131899 | 2 | 34309240 | 115571666 |
| 1750051846 | 2 | 37990784 | 162748048 |
I really need help for this situaion. Thanks for all
You can get the pbix from there
- Mark as New
- Bookmark
- Subscribe
- Mute
- Subscribe to RSS Feed
- Permalink
- Report Inappropriate Content
- Mark as New
- Bookmark
- Subscribe
- Mute
- Subscribe to RSS Feed
- Permalink
- Report Inappropriate Content
It isn't what i'm looking for. Not working !
Helpful resources

Microsoft Fabric Learn Together
Covering the world! 9:00-10:30 AM Sydney, 4:00-5:30 PM CET (Paris/Berlin), 7:00-8:30 PM Mexico City

Power BI Monthly Update - April 2024
Check out the April 2024 Power BI update to learn about new features.

| User | Count |
|---|---|
| 107 | |
| 100 | |
| 85 | |
| 77 | |
| 66 |
| User | Count |
|---|---|
| 120 | |
| 112 | |
| 94 | |
| 84 | |
| 75 |


