- Power BI forums
- Updates
- News & Announcements
- Get Help with Power BI
- Desktop
- Service
- Report Server
- Power Query
- Mobile Apps
- Developer
- DAX Commands and Tips
- Custom Visuals Development Discussion
- Health and Life Sciences
- Power BI Spanish forums
- Translated Spanish Desktop
- Power Platform Integration - Better Together!
- Power Platform Integrations (Read-only)
- Power Platform and Dynamics 365 Integrations (Read-only)
- Training and Consulting
- Instructor Led Training
- Dashboard in a Day for Women, by Women
- Galleries
- Community Connections & How-To Videos
- COVID-19 Data Stories Gallery
- Themes Gallery
- Data Stories Gallery
- R Script Showcase
- Webinars and Video Gallery
- Quick Measures Gallery
- 2021 MSBizAppsSummit Gallery
- 2020 MSBizAppsSummit Gallery
- 2019 MSBizAppsSummit Gallery
- Events
- Ideas
- Custom Visuals Ideas
- Issues
- Issues
- Events
- Upcoming Events
- Community Blog
- Power BI Community Blog
- Custom Visuals Community Blog
- Community Support
- Community Accounts & Registration
- Using the Community
- Community Feedback
Register now to learn Fabric in free live sessions led by the best Microsoft experts. From Apr 16 to May 9, in English and Spanish.
- Power BI forums
- Forums
- Get Help with Power BI
- Desktop
- DAX - Calculating Averages per hour
- Subscribe to RSS Feed
- Mark Topic as New
- Mark Topic as Read
- Float this Topic for Current User
- Bookmark
- Subscribe
- Printer Friendly Page
- Mark as New
- Bookmark
- Subscribe
- Mute
- Subscribe to RSS Feed
- Permalink
- Report Inappropriate Content
DAX - Calculating Averages per hour
Hi,
I am trying to calculate the average number of active documents at any given hour in a specific date range. (In the date range, 01/01/18 - 11/02/18, how many active documents have there been, on average, at 11:00?). I can get this to work for 1 day at a time, but cannot get it to do it over the date range.
On my report it is the graph I am trying to get to work, the 2 tables are essentially just my workings out/tests. I know the documents created/completed measures (counts and averages) are correct, but not the active documents measures.
My pbix file is https://drive.google.com/file/d/13PouI5wPiBIbaUD2CdLwUO2fgzeXZvZ-/view?usp=sharing
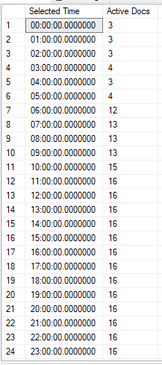
The trend should look like the Active Docs per day column in the image below.
Thanks for your help!
- Mark as New
- Bookmark
- Subscribe
- Mute
- Subscribe to RSS Feed
- Permalink
- Report Inappropriate Content
@Anonymous
You may try using AVERAGEX.
- https://community.powerbi.com/t5/Desktop/monthly-average-of-daily-sums/m-p/291451#M128396
- https://community.powerbi.com/t5/Desktop/Percentage-to-goal-by-dynamic-date-range/m-p/642778#M307965
If this post helps, then please consider Accept it as the solution to help the other members find it more quickly.
- Mark as New
- Bookmark
- Subscribe
- Mute
- Subscribe to RSS Feed
- Permalink
- Report Inappropriate Content
Thanks for replying. Unfortunately averagex doesn't quite work in this situation since the table I would be using is one full of measures. I essentially need to find the sum of the number of active documents at each hour and then divide that by the number of days in the date range.
I can do the second bit and divide by the number of days, but I cannot seem to find the sum per hour.
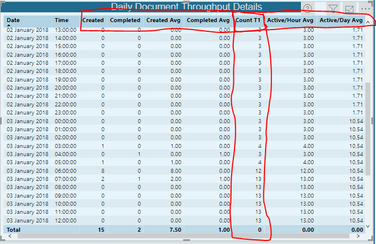
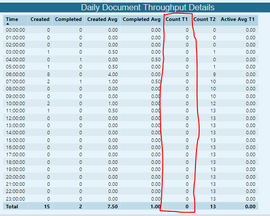
The red in the picture shows the measures. The count T1 is the measure I am interested in and it works when I have both dates and times on the table, but when I take the date column out, the measure sets the values to 0.
The DAX I am using is as follows
ActivePerHourCountTest1 =
CALCULATE(
    CALCULATE(
        COUNTA(IMSDocuments[Unique Document Id]) + 0,
        FILTER(
            IMSDocuments,
            IMSDocuments[Creation Date] + IMSDocuments[Creation Hour] <= SELECTEDVALUE(Dates[Date]) + SELECTEDVALUE(Times[Time])
        ),
        FILTER(
            IMSDocuments,
            OR(
                ISBLANK(IMSDocuments[Completion Date]),
                IMSDocuments[Completion Date] + IMSDocuments[Completion Hour] > SELECTEDVALUE(Dates[Date]) + SELECTEDVALUE(Times[Time])
            )
        )
    ),
    CROSSFILTER(Dates[Date], IMSDocuments[Creation Date], NONE)
)
For this date range, the table/count should sum up the values for both days. The second image should look like this
Helpful resources

Microsoft Fabric Learn Together
Covering the world! 9:00-10:30 AM Sydney, 4:00-5:30 PM CET (Paris/Berlin), 7:00-8:30 PM Mexico City

Power BI Monthly Update - April 2024
Check out the April 2024 Power BI update to learn about new features.

| User | Count |
|---|---|
| 106 | |
| 97 | |
| 80 | |
| 67 | |
| 63 |
| User | Count |
|---|---|
| 147 | |
| 110 | |
| 108 | |
| 85 | |
| 64 |


