- Power BI forums
- Updates
- News & Announcements
- Get Help with Power BI
- Desktop
- Service
- Report Server
- Power Query
- Mobile Apps
- Developer
- DAX Commands and Tips
- Custom Visuals Development Discussion
- Health and Life Sciences
- Power BI Spanish forums
- Translated Spanish Desktop
- Power Platform Integration - Better Together!
- Power Platform Integrations (Read-only)
- Power Platform and Dynamics 365 Integrations (Read-only)
- Training and Consulting
- Instructor Led Training
- Dashboard in a Day for Women, by Women
- Galleries
- Community Connections & How-To Videos
- COVID-19 Data Stories Gallery
- Themes Gallery
- Data Stories Gallery
- R Script Showcase
- Webinars and Video Gallery
- Quick Measures Gallery
- 2021 MSBizAppsSummit Gallery
- 2020 MSBizAppsSummit Gallery
- 2019 MSBizAppsSummit Gallery
- Events
- Ideas
- Custom Visuals Ideas
- Issues
- Issues
- Events
- Upcoming Events
- Community Blog
- Power BI Community Blog
- Custom Visuals Community Blog
- Community Support
- Community Accounts & Registration
- Using the Community
- Community Feedback
Register now to learn Fabric in free live sessions led by the best Microsoft experts. From Apr 16 to May 9, in English and Spanish.
- Power BI forums
- Galleries
- Data Stories Gallery
- Retail Store Sales Dashboard
Retail Store Sales Dashboard
02-22-2016 16:15 PM - last edited 06-28-2016 15:12 PM


- Mark as New
- Bookmark
- Subscribe
- Mute
- Subscribe to RSS Feed
- Permalink
- Report Inappropriate Content
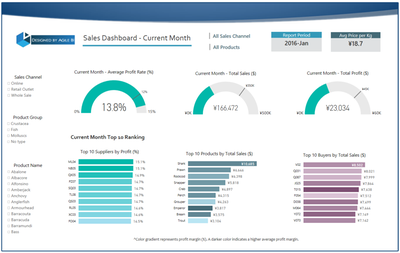
Retail Store Sales Dashboard
This Power BI solution show cases a powerful self-service Sales Dashboard for a famous retail store.
The dashboard consists of following 5 reports:
1. Current Month Performance - A view of KPIs for the current month and for tracking the progress towards target achievement.
2. Historical Performance - KPIs plotted over a longer period of time
3. Buyer Analysis - A time-based analysis to show how Profit Rate and Sales have evolved in the last 12 months
4. Supplier Analysis with Geographic View - A comparison of suppliers' performance across two regions (NSW, VIC)
5. Retail outlet sales heatmap - Using custom map (outlet floor plan) to visualize which stores are most "popular"
(Note: This solution uses sample data and a reduced compelxity in data model for the purpose of demo)
Learn more about this report from the author by watching this video: https://youtu.be/U70w1m5vnDY

eyJrIjoiMjJmN2FhMjctNDgxNi00NDYxLTkzZjItOTAzZmE2MTQyMDA3IiwidCI6IjU3NGMzZTU2LTQ5MjQtNDAwNC1hZDFhLWQ4NDI3ZTdkYjI0MSIsImMiOjZ9