- Power BI forums
- Updates
- News & Announcements
- Get Help with Power BI
- Desktop
- Service
- Report Server
- Power Query
- Mobile Apps
- Developer
- DAX Commands and Tips
- Custom Visuals Development Discussion
- Health and Life Sciences
- Power BI Spanish forums
- Translated Spanish Desktop
- Power Platform Integration - Better Together!
- Power Platform Integrations (Read-only)
- Power Platform and Dynamics 365 Integrations (Read-only)
- Training and Consulting
- Instructor Led Training
- Dashboard in a Day for Women, by Women
- Galleries
- Community Connections & How-To Videos
- COVID-19 Data Stories Gallery
- Themes Gallery
- Data Stories Gallery
- R Script Showcase
- Webinars and Video Gallery
- Quick Measures Gallery
- 2021 MSBizAppsSummit Gallery
- 2020 MSBizAppsSummit Gallery
- 2019 MSBizAppsSummit Gallery
- Events
- Ideas
- Custom Visuals Ideas
- Issues
- Issues
- Events
- Upcoming Events
- Community Blog
- Power BI Community Blog
- Custom Visuals Community Blog
- Community Support
- Community Accounts & Registration
- Using the Community
- Community Feedback
Register now to learn Fabric in free live sessions led by the best Microsoft experts. From Apr 16 to May 9, in English and Spanish.
- Power BI forums
- Forums
- Get Help with Power BI
- DAX Commands and Tips
- showing zero instead of blank in pivot table or ba...
- Subscribe to RSS Feed
- Mark Topic as New
- Mark Topic as Read
- Float this Topic for Current User
- Bookmark
- Subscribe
- Printer Friendly Page
- Mark as New
- Bookmark
- Subscribe
- Mute
- Subscribe to RSS Feed
- Permalink
- Report Inappropriate Content
showing zero instead of blank in pivot table or bar chart
Hello All,
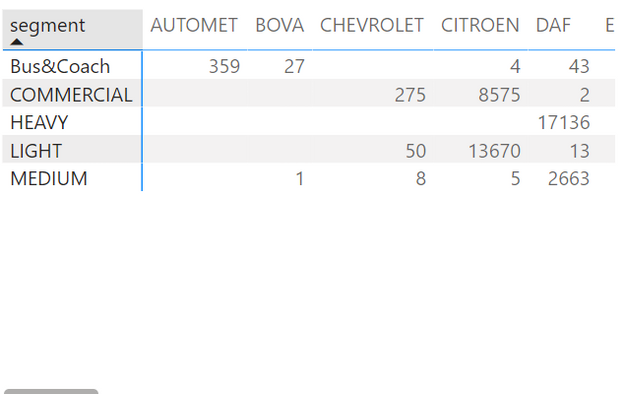
I have created the below pivot table :
I need to replace the blank values by 0. The Segment column and the Brand column both come from the same Dim Table.
The mesure is a count of of a column in the fact table. Some of the brands don't have a relationship with all the segments.
I need it to show as 0 because when I transform the pivot table in a bar chart, all the segment still need to show on the bar chart and not disapear when it is blank. For example, if I select Automet on a filter, then the bar chart will only show the bus&coach segment. Instead, I still need the bar chart to show me the other segment with no values like below:
I have tried IF(ISBLANK(count(column)), 0, count(column))
How could I fix it ?
Thanks
Solved! Go to Solution.
- Mark as New
- Bookmark
- Subscribe
- Mute
- Subscribe to RSS Feed
- Permalink
- Report Inappropriate Content
It works better when rows and columns are coming from separate dimension/table
Please provide sample data.
- Mark as New
- Bookmark
- Subscribe
- Mute
- Subscribe to RSS Feed
- Permalink
- Report Inappropriate Content
Previous posters already hinted at this, but if the "+ 0" doesn't work, then the issue is with your dimension table not containing the Segment/Brand combinations you want to show zeros for. This can't be solved with a dax measure.
So either make sure the dimension table contains these combinations or otherwise create an additional dimension table and link that to the fact.
- Mark as New
- Bookmark
- Subscribe
- Mute
- Subscribe to RSS Feed
- Permalink
- Report Inappropriate Content
@sjoerdvn thanks for the help. They do contain the combinations. I think I will just create a separte dimensions.
- Mark as New
- Bookmark
- Subscribe
- Mute
- Subscribe to RSS Feed
- Permalink
- Report Inappropriate Content
Did you try it inside your transformation table with the folowing DAX statement?
modified_column =
IF (
    LEN ( column[Name] ) = 0, 0,column[Name]
)
- Mark as New
- Bookmark
- Subscribe
- Mute
- Subscribe to RSS Feed
- Permalink
- Report Inappropriate Content
- Mark as New
- Bookmark
- Subscribe
- Mute
- Subscribe to RSS Feed
- Permalink
- Report Inappropriate Content
It works better when rows and columns are coming from separate dimension/table
Please provide sample data.
- Mark as New
- Bookmark
- Subscribe
- Mute
- Subscribe to RSS Feed
- Permalink
- Report Inappropriate Content
So fact table would be as below:
| Column(to count) | BrandID |
| aaa | 1 |
| bbbb | 2 |
| zzz | 3 |
| ee | 4 |
| rrz | 5 |
| ete | 6 |
| zr | 7 |
| er | 8 |
The dim table would be as below:
| segment | Brand | BrandID |
| Bus&Coach | VOLVO | 1 |
| COMMERCIAL | VOLVO | 2 |
| HEAVY | VOLVO | 3 |
| MEDIUM | VOLVO | 4 |
| Bus&Coach | VOLKSWAGEN | 5 |
| COMMERCIAL | VOLKSWAGEN | 6 |
| LIGHT | VOLKSWAGEN | 7 |
| Bus&Coach | VDL | 8 |
- Mark as New
- Bookmark
- Subscribe
- Mute
- Subscribe to RSS Feed
- Permalink
- Report Inappropriate Content
You can try this count(column)+0
- Mark as New
- Bookmark
- Subscribe
- Mute
- Subscribe to RSS Feed
- Permalink
- Report Inappropriate Content
Helpful resources

Microsoft Fabric Learn Together
Covering the world! 9:00-10:30 AM Sydney, 4:00-5:30 PM CET (Paris/Berlin), 7:00-8:30 PM Mexico City

Power BI Monthly Update - April 2024
Check out the April 2024 Power BI update to learn about new features.

| User | Count |
|---|---|
| 37 | |
| 25 | |
| 19 | |
| 14 | |
| 8 |
| User | Count |
|---|---|
| 69 | |
| 48 | |
| 44 | |
| 19 | |
| 15 |


