- Power BI forums
- Updates
- News & Announcements
- Get Help with Power BI
- Desktop
- Service
- Report Server
- Power Query
- Mobile Apps
- Developer
- DAX Commands and Tips
- Custom Visuals Development Discussion
- Health and Life Sciences
- Power BI Spanish forums
- Translated Spanish Desktop
- Power Platform Integration - Better Together!
- Power Platform Integrations (Read-only)
- Power Platform and Dynamics 365 Integrations (Read-only)
- Training and Consulting
- Instructor Led Training
- Dashboard in a Day for Women, by Women
- Galleries
- Community Connections & How-To Videos
- COVID-19 Data Stories Gallery
- Themes Gallery
- Data Stories Gallery
- R Script Showcase
- Webinars and Video Gallery
- Quick Measures Gallery
- 2021 MSBizAppsSummit Gallery
- 2020 MSBizAppsSummit Gallery
- 2019 MSBizAppsSummit Gallery
- Events
- Ideas
- Custom Visuals Ideas
- Issues
- Issues
- Events
- Upcoming Events
- Community Blog
- Power BI Community Blog
- Custom Visuals Community Blog
- Community Support
- Community Accounts & Registration
- Using the Community
- Community Feedback
Register now to learn Fabric in free live sessions led by the best Microsoft experts. From Apr 16 to May 9, in English and Spanish.
- Power BI forums
- Forums
- Get Help with Power BI
- DAX Commands and Tips
- DAX command for filtering data
- Subscribe to RSS Feed
- Mark Topic as New
- Mark Topic as Read
- Float this Topic for Current User
- Bookmark
- Subscribe
- Printer Friendly Page
- Mark as New
- Bookmark
- Subscribe
- Mute
- Subscribe to RSS Feed
- Permalink
- Report Inappropriate Content
DAX command for filtering data
I have a table with a column containing time intervals. I have nearly 1000 records on this table, and I need to calculate the average time interval, discarding the 10% longer intervals. How can I filter this? Is there a DAX command I can use for that?
Solved! Go to Solution.
- Mark as New
- Bookmark
- Subscribe
- Mute
- Subscribe to RSS Feed
- Permalink
- Report Inappropriate Content
Wow. This was much more challenging than I thought.
I just learned the following from Greg Deckler here:
- DAX & Excel have no true time duration data type!
- That's why performing aggregate functions on HH:MM:SS data does NOT work.
https://community.powerbi.com/t5/Community-Blog/Aggregating-Duration-Time/ba-p/22486
So after performing the first 3 steps in the post above, Step 4 has the below sub-steps. You can probably combine some of my steps, but I left them all in to show the thought process.
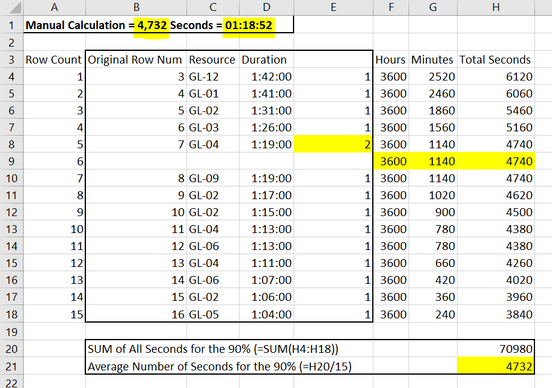
4A) Manually calculate the average weighted time in Excel, which is:
- 4,732 seconds
- OR 01:18:52
These are the answers to which we will compare our DAX calculations at the end.
NOTE: Remember that Row 7 counts twice @ 1:19:00, which makes a total row count of 15.
4B) Create a Calculated Column in the 'Rows To Keep' table for [Seconds].
4C) Create a Calculated Column in the 'Rows To Keep' table for [Seconds Weighted].
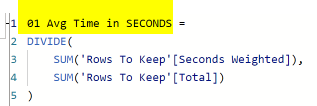
4D) Create a measure to calculate [Avg Time in SECONDS].
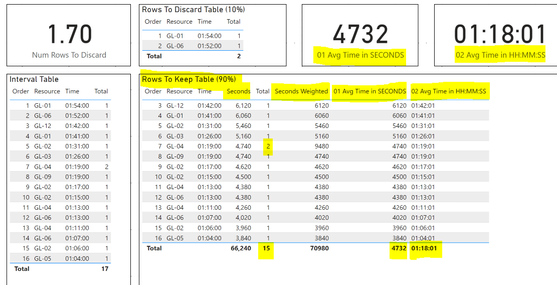
NOTE: As you will see in the results screenshot below, this measure is a perfect match for our manually calculated number of seconds, 4732.
4E) Create a measure to convert from [Avg Time in Seconds] back into [Avg Time in HH:MM:SS].
NOTE: As you will see in the results screenshot below, the final DAX calculation is not 01:18:52, but rather 01:18:01. I believe this has to do with the differences between:
- DIVIDE function
- MOD function
- / operator
I messed with this final formula for a while, trying variations of the above 3 options, but the closest I could get was 20 seconds from 01:18:52. Hoping you can get this last formula to your satisfaction of seconds.
Unfortunately, since DAX & Excel do not support a true duration data type, we have to workaround this by converting to seconds, performing the calculation, & then converting back again.
Hope this is helpful to you.
Regards,
Nathan
- Mark as New
- Bookmark
- Subscribe
- Mute
- Subscribe to RSS Feed
- Permalink
- Report Inappropriate Content
- Mark as New
- Bookmark
- Subscribe
- Mute
- Subscribe to RSS Feed
- Permalink
- Report Inappropriate Content
Wow. This was much more challenging than I thought.
I just learned the following from Greg Deckler here:
- DAX & Excel have no true time duration data type!
- That's why performing aggregate functions on HH:MM:SS data does NOT work.
https://community.powerbi.com/t5/Community-Blog/Aggregating-Duration-Time/ba-p/22486
So after performing the first 3 steps in the post above, Step 4 has the below sub-steps. You can probably combine some of my steps, but I left them all in to show the thought process.
4A) Manually calculate the average weighted time in Excel, which is:
- 4,732 seconds
- OR 01:18:52
These are the answers to which we will compare our DAX calculations at the end.
NOTE: Remember that Row 7 counts twice @ 1:19:00, which makes a total row count of 15.
4B) Create a Calculated Column in the 'Rows To Keep' table for [Seconds].
4C) Create a Calculated Column in the 'Rows To Keep' table for [Seconds Weighted].
4D) Create a measure to calculate [Avg Time in SECONDS].
NOTE: As you will see in the results screenshot below, this measure is a perfect match for our manually calculated number of seconds, 4732.
4E) Create a measure to convert from [Avg Time in Seconds] back into [Avg Time in HH:MM:SS].
NOTE: As you will see in the results screenshot below, the final DAX calculation is not 01:18:52, but rather 01:18:01. I believe this has to do with the differences between:
- DIVIDE function
- MOD function
- / operator
I messed with this final formula for a while, trying variations of the above 3 options, but the closest I could get was 20 seconds from 01:18:52. Hoping you can get this last formula to your satisfaction of seconds.
Unfortunately, since DAX & Excel do not support a true duration data type, we have to workaround this by converting to seconds, performing the calculation, & then converting back again.
Hope this is helpful to you.
Regards,
Nathan
- Mark as New
- Bookmark
- Subscribe
- Mute
- Subscribe to RSS Feed
- Permalink
- Report Inappropriate Content
Thank you so much for your help!
Your solution is exactly what I was looking for, and also gave me some really good ideas to improve my dashboards.
Regards,
Rodnei
- Mark as New
- Bookmark
- Subscribe
- Mute
- Subscribe to RSS Feed
- Permalink
- Report Inappropriate Content
OK. I'm close to the finish line, but not quite there (assuming my guesses are correct).
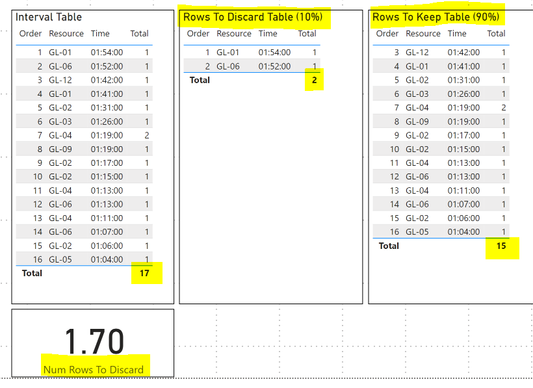
1) Create a measure to calculate the number of rows to discard.
2) Create a New Table of the Rows to Discard.
3) Create a New Table of the Rows to Keep.
4) Create a measure which calculates the weighted average (remembering 1:19:00 counts TWICE for Row 7) of 'Rows To Keep'[Time].
- I haven't figured this out yet. I thought this would be simple. However, working with the HH:MM:SS format is giving me bizarre results.
Hope what I have so far is helpful to you.
I'll update you when I figure out Step 4.
Regards,
Nathan
- Mark as New
- Bookmark
- Subscribe
- Mute
- Subscribe to RSS Feed
- Permalink
- Report Inappropriate Content
This is very helpful. Thank you.
A couple more q's:
1) There is one row WHERE Total = 2. I believe this means we should treat the table as if there are actually two rows of (GL-04 & 01:19:00). Is that right?
2) To identify the Top 10% (to be discarded), I first need a measure that calculates the total number of rows. If my guess in question #1 above is correct, the total number of visible rows in the screenshot should be 17 (and not 16). Is that also correct?
3) Finally, how do you want the discard rounded (rounding up or down)?
- 10% of 17 = 1.7. Does this mean you want the TOP 2 records discarded out of 17? Or should only 1 record be discarded out of 17?
Regards,
Nathan
- Mark as New
- Bookmark
- Subscribe
- Mute
- Subscribe to RSS Feed
- Permalink
- Report Inappropriate Content
1) Are you able to provide a screenshot of what some of the values are for this time interval column?
2) Would you also point out an example of a record which should be discarded due to "10% longer intervals". I'm not yet understanding what this means.
Regards,
Nathan
- Mark as New
- Bookmark
- Subscribe
- Mute
- Subscribe to RSS Feed
- Permalink
- Report Inappropriate Content
Thank you for your help, Nathan!
This table shows how long some service vehicles took to respond to incidents. I need to discard the 10% longest times (1:54 is the longest, on this case), and calculate the average response time of the other 90%.
Helpful resources

Microsoft Fabric Learn Together
Covering the world! 9:00-10:30 AM Sydney, 4:00-5:30 PM CET (Paris/Berlin), 7:00-8:30 PM Mexico City

Power BI Monthly Update - April 2024
Check out the April 2024 Power BI update to learn about new features.

| User | Count |
|---|---|
| 56 | |
| 27 | |
| 23 | |
| 15 | |
| 11 |
| User | Count |
|---|---|
| 78 | |
| 63 | |
| 47 | |
| 17 | |
| 12 |


