- Power BI forums
- Updates
- News & Announcements
- Get Help with Power BI
- Desktop
- Service
- Report Server
- Power Query
- Mobile Apps
- Developer
- DAX Commands and Tips
- Custom Visuals Development Discussion
- Health and Life Sciences
- Power BI Spanish forums
- Translated Spanish Desktop
- Power Platform Integration - Better Together!
- Power Platform Integrations (Read-only)
- Power Platform and Dynamics 365 Integrations (Read-only)
- Training and Consulting
- Instructor Led Training
- Dashboard in a Day for Women, by Women
- Galleries
- Community Connections & How-To Videos
- COVID-19 Data Stories Gallery
- Themes Gallery
- Data Stories Gallery
- R Script Showcase
- Webinars and Video Gallery
- Quick Measures Gallery
- 2021 MSBizAppsSummit Gallery
- 2020 MSBizAppsSummit Gallery
- 2019 MSBizAppsSummit Gallery
- Events
- Ideas
- Custom Visuals Ideas
- Issues
- Issues
- Events
- Upcoming Events
- Community Blog
- Power BI Community Blog
- Custom Visuals Community Blog
- Community Support
- Community Accounts & Registration
- Using the Community
- Community Feedback
Register now to learn Fabric in free live sessions led by the best Microsoft experts. From Apr 16 to May 9, in English and Spanish.
- Power BI forums
- Forums
- Get Help with Power BI
- DAX Commands and Tips
- Calculate the percentage weight of each customer i...
- Subscribe to RSS Feed
- Mark Topic as New
- Mark Topic as Read
- Float this Topic for Current User
- Bookmark
- Subscribe
- Printer Friendly Page
- Mark as New
- Bookmark
- Subscribe
- Mute
- Subscribe to RSS Feed
- Permalink
- Report Inappropriate Content
Calculate the percentage weight of each customer in the customer portfolio to which it belongs
Hi friends, I need help calculating what percentage weight each client has within the client portfolio to which it belongs.
In Power BI I have a semantic data model composed as follows:
Available tables:
A sales table "f_Sales" with the following fields: DATE, CUSTUMER ID, PRODUCT ID, QTY, SALES AMOUNT
A customer table "d_customer table" with the following fields: CUSTUMER ID, CUSTUMER NAME
A customer portfolio table "d_(portfolio)" with the following fields: SELLER ID, CUSTUMER ID
A seller table "d_Sellers" with the following fields: ID SELLER, NAME SELLER
RELATIONSHIPS:
The "d_Sellers" table is related to the "d_(portfolio)" table through the "SELLER ID" field.
The "d_(portfolio)" table is related to the "d_customer table" table through the "CUSTUMER ID" field.
The "d_customer table" table is related to the "f_Sales" table through the "CUSTUMER ID" field.
PROBLEM TO SOLVE
Based on the tables, available fields and relationships presented above, I need to calculate the percentage weight that each customer has within the portfolio to which it belongs based on average sales.
Example:
Suppose that salesperson1 is responsible for four customers. I need to know what each customer's share is for this seller.
SELLER 1
Customer 1 = 60%
Customer 2 = 15%
Customer 3 = 10%
Customer 4 = 5%
Total = 100%
The DAX measurement I made below works, but it is slow and inefficient, as the visual does not load. I need some other solution.
DIVIDE(
    [| Sales Avarege] ,

    CALCULATE(
		    [| Sales Avarege],
		    ALL('d_customer table'),
		    VALUES('d_(portfolio)'[ID Seller])
		)
)
I also tried the following DAX measure below, it is fast and the visuals load quickly, but it only works if a filter is applied in the Seller slicer, otherwise the numbers are incorrect.
DIVIDE(
    [| Sales Avarege] ,

    CALCULATE(
		    [| Sales Avarege],
		    ALL('d_customer table'),ALL('d_(portfolio)'[Custumer ID])
		)
)
- Mark as New
- Bookmark
- Subscribe
- Mute
- Subscribe to RSS Feed
- Permalink
- Report Inappropriate Content
Hi @Rai_BI
Please try
Weight% =
SUMX (
    VALUES ('d_customer table'[Custumer ID] ),
    DIVIDE(
        [| Sales Avarege] ,
        CALCULATE(
                [| Sales Avarege],
                ALL ( 'd_customer table' )
            )
    )
)- Mark as New
- Bookmark
- Subscribe
- Mute
- Subscribe to RSS Feed
- Permalink
- Report Inappropriate Content
Hi @tamerj1 , thank you for your help.
It's not working properly. It is necessary to filter a seller for the measure to make the correct calculation.
Filtering a seller
No filters on the seller
Here I am filtering only customers from seller 1. See that the percentages are different from the previous screenshot.
- Mark as New
- Bookmark
- Subscribe
- Mute
- Subscribe to RSS Feed
- Permalink
- Report Inappropriate Content
@Rai_BI
Not sure how did you get 0.15% at the total while the slicers are set to "All"! In the sample file you have shared with me the total is always 100% regardless of the slicer selection. I thought that was the intention.
However, in order to fix the percentage of the individual customers regardless of the what seleters are selected in the slicer you can try
Weight% =
SUMX (
    VALUES ('d_customer table'[Custumer ID] ),
    DIVIDE(
        [| Sales Avarege] ,
        CALCULATE (
            [| Sales Avarege],
            ALL ( 'd_customer table' ),
            ALL ( d_Sellers )
        )
    )
)- Mark as New
- Bookmark
- Subscribe
- Mute
- Subscribe to RSS Feed
- Permalink
- Report Inappropriate Content
Each salesperson is responsible for a customer group (portfolio). My intention is to calculate the share of each customer for their respective vendor regardless of whether there is a filter in the seller's or customer's slicer or the seller's name is applied to the visual. This way I will be able to redistribute the seller's target to their respective customers based on their share (%). Or filter the most important customers, for example those with a share greater than 50%.
The measure you suggested (Weight% v2) does not correctly calculate the percentages for each customer see below.
Filtering seller1´s client
- Mark as New
- Bookmark
- Subscribe
- Mute
- Subscribe to RSS Feed
- Permalink
- Report Inappropriate Content
Hi @Rai_BI
Ok, now I understand your requirement. However, some customers appear in multiple portfolios. For example in the following screenshot, in case both seller 14 and seller 16 are part of the slicer's selection, in order to calculate the percentage of customer 9256, over which total shall we divide? The total of the portfolio of seller 14 or seller 16? Or do you think this just a data error?
- Mark as New
- Bookmark
- Subscribe
- Mute
- Subscribe to RSS Feed
- Permalink
- Report Inappropriate Content
Hi @tamerj1
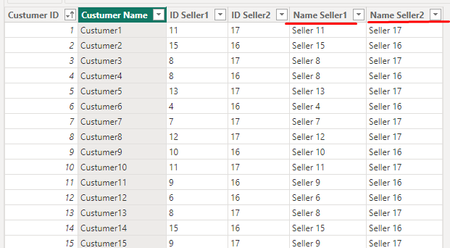
There are two types of sellers, type 1 and type 2. Each customer is served by these two types, you can see these two types in the "d_Customer table".
Each customer is served by these two types, you can see these two types in the "d_Customer table".
The "d_(portfolio)" table is a bridge table between the "d_Customer table" and the "d_Sellers" table.
When you place the "Name Seller" field and the "Customer Name" field in the visual you will see the types of sellers, type 1 and type 2 for the same customer.
- Mark as New
- Bookmark
- Subscribe
- Mute
- Subscribe to RSS Feed
- Permalink
- Report Inappropriate Content
@Rai_BI
Thank you for clarifying this important point. However, this does not answer my question. In other words how do you define a portfolio? And if a customer belong to more than one portfolio, then how shall we handle the calculation. I hope the example that I have presented in my previous reply explains my point. Please let me know if it doesn't.
- Mark as New
- Bookmark
- Subscribe
- Mute
- Subscribe to RSS Feed
- Permalink
- Report Inappropriate Content
I need to think about how to best clarify this. A customer is served by two types of salesperson, type 1 and type 2.
It is unlikely that the share of a customer for a type 1 seller will be the same for a type 2 seller.
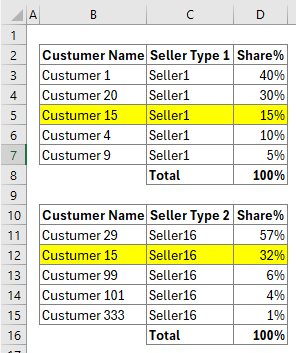
See the illustration below, sellers "Seller1" and "Seller16" have "Customer 15" in common, but notice that this customer's share for "Seller1" is completely different from "Seller16". A customer may be important to one type of seller but not so important to another seller.
The customer portfolio is defined by the seller's code, as each seller is responsible for a group of customers. The observation is that there are two types of sellers (as shown in the screenshot below). This is why there will always be two sellers (or two wallets) for each customer, but the wallets of the type 1 seller are not the same as the type 2 seller, it just happens that there is a customer in common between them, as shown in the screenshot above.
- Mark as New
- Bookmark
- Subscribe
- Mute
- Subscribe to RSS Feed
- Permalink
- Report Inappropriate Content
Fair enough. But my question was based on the screenshot that you have provided earlier where type1 seller and type2 seller are not part of the visual's filter context
if you select one seller in the slicer then we get a percentage fro customer 15. If we select the other seller then we get a different percentage of customer 15. If we select both sellers then which percentage is to be presented?
Now if you confirm that the calculation would be only caried out while either seller type1 or type2 would be part of the filter context then this is a whole different story.
- Mark as New
- Bookmark
- Subscribe
- Mute
- Subscribe to RSS Feed
- Permalink
- Report Inappropriate Content
@tamerj1 I understood your point. Now I fear it will be necessary to take two separate measurements.
My intention is to multiply the customer's share by the respective salesperson's goal, so it will be necessary to make the measurement using the "IF" condition.
For example "IF" seller type 1 is filtered then do the calculation considering seller type 1. Otherwise "IF" seller type 2 is filtered then make the calculation considering seller type 2.
If neither type of seller is filtered, then I will have to add the two measurements together, so the customer will receive two goals relating to the two types of seller.
- Mark as New
- Bookmark
- Subscribe
- Mute
- Subscribe to RSS Feed
- Permalink
- Report Inappropriate Content
- Mark as New
- Bookmark
- Subscribe
- Mute
- Subscribe to RSS Feed
- Permalink
- Report Inappropriate Content
Thank you, unfortunately I haven't reached my goal yet. I'll have to think of some other way to do this.
Helpful resources

Microsoft Fabric Learn Together
Covering the world! 9:00-10:30 AM Sydney, 4:00-5:30 PM CET (Paris/Berlin), 7:00-8:30 PM Mexico City

Power BI Monthly Update - April 2024
Check out the April 2024 Power BI update to learn about new features.

| User | Count |
|---|---|
| 40 | |
| 27 | |
| 20 | |
| 15 | |
| 8 |
| User | Count |
|---|---|
| 71 | |
| 48 | |
| 46 | |
| 20 | |
| 16 |


