- Power BI forums
- Updates
- News & Announcements
- Get Help with Power BI
- Desktop
- Service
- Report Server
- Power Query
- Mobile Apps
- Developer
- DAX Commands and Tips
- Custom Visuals Development Discussion
- Health and Life Sciences
- Power BI Spanish forums
- Translated Spanish Desktop
- Power Platform Integration - Better Together!
- Power Platform Integrations (Read-only)
- Power Platform and Dynamics 365 Integrations (Read-only)
- Training and Consulting
- Instructor Led Training
- Dashboard in a Day for Women, by Women
- Galleries
- Community Connections & How-To Videos
- COVID-19 Data Stories Gallery
- Themes Gallery
- Data Stories Gallery
- R Script Showcase
- Webinars and Video Gallery
- Quick Measures Gallery
- 2021 MSBizAppsSummit Gallery
- 2020 MSBizAppsSummit Gallery
- 2019 MSBizAppsSummit Gallery
- Events
- Ideas
- Custom Visuals Ideas
- Issues
- Issues
- Events
- Upcoming Events
- Community Blog
- Power BI Community Blog
- Custom Visuals Community Blog
- Community Support
- Community Accounts & Registration
- Using the Community
- Community Feedback
Earn a 50% discount on the DP-600 certification exam by completing the Fabric 30 Days to Learn It challenge.
- Power BI forums
- Forums
- Get Help with Power BI
- Desktop
- Re: Timeintelligence calculation group
- Subscribe to RSS Feed
- Mark Topic as New
- Mark Topic as Read
- Float this Topic for Current User
- Bookmark
- Subscribe
- Printer Friendly Page
- Mark as New
- Bookmark
- Subscribe
- Mute
- Subscribe to RSS Feed
- Permalink
- Report Inappropriate Content
Timeintelligence calculation group
Hi everyone,
I have a YoY calculation item
VAR PREV = CALCULATE ( SELECTEDMEASURE (), sameperiodlastyear ( '_CALENDAR'[Date]) )
RETURN IF(OR(ISBLANK(PREV),ISBLANK(SELECTEDMEASURE ())),BLANK(), SELECTEDMEASURE () / PREV - 1)
that works as intended for the left chart:
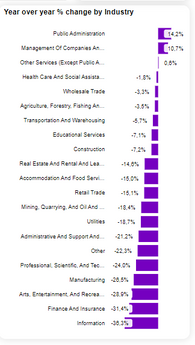
But not for the one on the right - I would like it to show the latest month available, unless the user clicks the chart on the left and selects a date - then show the result for that date. It works as intended when the right hand side chart is clicked on:
But if nothing is selected it shows (sum of all job postings across all dates) / (sum of all job postings across all dates EXCEPT latest 12 months).
I know I can do this using two separate measures but then I can't use the slicer in the top right to allow the user to switch between YoY and MoM.
Why am I even doing this, doesn't it just duplicate the result from the left chart in the one on the right? For now yes, but the right chart will show changes broken down by industry.
Any help much appreciated, thank you.
Solved! Go to Solution.
- Mark as New
- Bookmark
- Subscribe
- Mute
- Subscribe to RSS Feed
- Permalink
- Report Inappropriate Content
Hi @mbidelski
You could use LASTNONBLANK to identify the last date where SELECTEDMEASURE() is nonblank, then expand this to a month with PARALLELPERIOD.
This should leave the left chart unchanged, but adjust the right chart to display just the latest month.
Here is how I would write it.
I slightly rewrote the final expression after RETURN, but you don't have to change that.
-- Find the last month for which SELECTEDMEASURE() is nonblank
VAR LastMonthAvailable =
    PARALLELPERIOD (
        LASTNONBLANK ( 'Date'[Date], SELECTEDMEASURE ( ) ),
        0,
        MONTH
    )
VAR PREV =
    CALCULATE (
        SELECTEDMEASURE ( ),
        SAMEPERIODLASTYEAR ( LastMonthAvailable )
    )
VAR CURR = CALCULATE ( SELECTEDMEASURE ( ), LastMonthAvailable )
RETURN
    IF (
        AND ( NOT ISBLANK ( PREV ), NOT ISBLANK ( CURR ) ),
        DIVIDE ( CURR - PREV, PREV )
    )
Does this work for you?
Regards
- Mark as New
- Bookmark
- Subscribe
- Mute
- Subscribe to RSS Feed
- Permalink
- Report Inappropriate Content
Quick followup question, I tried putting your code in a DAX measure and this fragment specifically:
var CurrDate =     PARALLELPERIOD (
        LASTNONBLANK ( '_CALENDAR'[Date], [JP] ),
        0,
        MONTH
    )
throws up an error:
The calculation group item works like a charm btw, so not sure what's wrong here?
- Mark as New
- Bookmark
- Subscribe
- Mute
- Subscribe to RSS Feed
- Permalink
- Report Inappropriate Content
Glad the calc group solution worked 🙂
Regarding your follow-up question - what is the complete measure that you are testing?
The PARALLELPERIOD expression returns a table, specifically a month-worth of dates.
As this is a table rather than scalar value, it cannot itself be returned by a measure, or used anywhere that expects a scalar value.
Based on the error message, it appears that the CurrDate variable is being used somewhere that expects a scalar value.
- Mark as New
- Bookmark
- Subscribe
- Mute
- Subscribe to RSS Feed
- Permalink
- Report Inappropriate Content
Thank you for your help! Here's the entire measure, it's essentially the same as the calculation item, just for a card visual.
and here's the error:
and the error when I have it return just the Current Date:
- Mark as New
- Bookmark
- Subscribe
- Mute
- Subscribe to RSS Feed
- Permalink
- Report Inappropriate Content
Thanks 🙂
The first problem I can see is that your measure appears to be making use of filters from the '_Time Intelligence' calculation Group table.
This won't work, because if the calculation group column is filtered it will be applied to this measure, which you don't want in this case. The first error relates to the calculation group trying to apply to this measure when it returns text.
You will need to create an independent parameter table to allow switching for this measure.
One other question: Do you plan to replace "" with numerical values? A the moment, I can't see where this measure returns any result that isn't text.
Regards
- Mark as New
- Bookmark
- Subscribe
- Mute
- Subscribe to RSS Feed
- Permalink
- Report Inappropriate Content
Briliant advice once again, indeed it was the calculation item causing the problem. But this causes another problem, how do I control the calculation group with an independent parameter? Right now the the Calc Group is in a filter:
so controlling it with an independent param - I guess I would need to check it from within the timeintelligence measures...?
One other question: Do you plan to replace "" with numerical values? A the moment, I can't see where this measure returns any result that isn't text.No, that's just a blank space, here is how it looks like when it works:
So essentially it either shows no data or is invisible.
- Mark as New
- Bookmark
- Subscribe
- Mute
- Subscribe to RSS Feed
- Permalink
- Report Inappropriate Content
That's briliant, thanks a million!
Helpful resources
| User | Count |
|---|---|
| 102 | |
| 90 | |
| 80 | |
| 71 | |
| 70 |
| User | Count |
|---|---|
| 114 | |
| 100 | |
| 97 | |
| 72 | |
| 71 |


