- Power BI forums
- Updates
- News & Announcements
- Get Help with Power BI
- Desktop
- Service
- Report Server
- Power Query
- Mobile Apps
- Developer
- DAX Commands and Tips
- Custom Visuals Development Discussion
- Health and Life Sciences
- Power BI Spanish forums
- Translated Spanish Desktop
- Power Platform Integration - Better Together!
- Power Platform Integrations (Read-only)
- Power Platform and Dynamics 365 Integrations (Read-only)
- Training and Consulting
- Instructor Led Training
- Dashboard in a Day for Women, by Women
- Galleries
- Community Connections & How-To Videos
- COVID-19 Data Stories Gallery
- Themes Gallery
- Data Stories Gallery
- R Script Showcase
- Webinars and Video Gallery
- Quick Measures Gallery
- 2021 MSBizAppsSummit Gallery
- 2020 MSBizAppsSummit Gallery
- 2019 MSBizAppsSummit Gallery
- Events
- Ideas
- Custom Visuals Ideas
- Issues
- Issues
- Events
- Upcoming Events
- Community Blog
- Power BI Community Blog
- Custom Visuals Community Blog
- Community Support
- Community Accounts & Registration
- Using the Community
- Community Feedback
Earn a 50% discount on the DP-600 certification exam by completing the Fabric 30 Days to Learn It challenge.
- Power BI forums
- Forums
- Get Help with Power BI
- Desktop
- Re: TOTAL COLUMN: NEED SIMPLE AVERAGE
- Subscribe to RSS Feed
- Mark Topic as New
- Mark Topic as Read
- Float this Topic for Current User
- Bookmark
- Subscribe
- Printer Friendly Page
- Mark as New
- Bookmark
- Subscribe
- Mute
- Subscribe to RSS Feed
- Permalink
- Report Inappropriate Content
TOTAL COLUMN: NEED SIMPLE AVERAGE
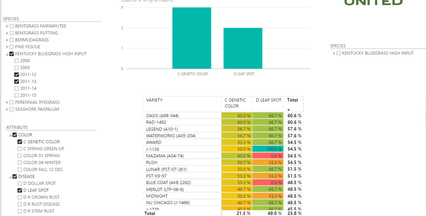
Community: I'm very new to Power BI. I'm struggling with one issue. My dashboard works just fine except for one issue. How do I change the Total Column to calculate a simple average vs. a weighted average? The column values are all averages. I use the slicers to select multiple attributes that populate the columns. I have multiple slicers i want to use. The Total is giving a weighted average (just what its suppose to do!) What I need is a simple average. For the first row, I want this: (ROW SUM)/COUNT OF COLUMNS) (60.0 + 66.7)2 = 63.35. The weighted average = 60.6 because I have more C GENETIC COLOR data than D LEAF SPOT DATA. Data = # of Trials. Any thoughts on how I can solve this? I want to be able to select with the slicers any number of attributes and Years and have a simple average total column.
Thoughts on how to do this? Really appreciate the help.
Solved! Go to Solution.
- Mark as New
- Bookmark
- Subscribe
- Mute
- Subscribe to RSS Feed
- Permalink
- Report Inappropriate Content
@12489 wrote:
Community: I'm very new to Power BI. I'm struggling with one issue. My dashboard works just fine except for one issue. How do I change the Total Column to calculate a simple average vs. a weighted average? The column values are all averages. I use the slicers to select multiple attributes that populate the columns. I have multiple slicers i want to use. The Total is giving a weighted average (just what its suppose to do!) What I need is a simple average. For the first row, I want this: (ROW SUM)/COUNT OF COLUMNS) (60.0 + 66.7)2 = 63.35. The weighted average = 60.6 because I have more C GENETIC COLOR data than D LEAF SPOT DATA. Data = # of Trials. Any thoughts on how I can solve this? I want to be able to select with the slicers any number of attributes and Years and have a simple average total column.
Thoughts on how to do this? Really appreciate the help.
Do you know measure? I think you can create another measure like below. If it won't work, could you upload your sample pbix file?
average total = (AVERAGE([C GENETIC COLOR])+AVARAGE([D LEAF SPOT]))/2
- Mark as New
- Bookmark
- Subscribe
- Mute
- Subscribe to RSS Feed
- Permalink
- Report Inappropriate Content
Let me try that. Appreciate the help...
Helpful resources
| User | Count |
|---|---|
| 98 | |
| 90 | |
| 77 | |
| 71 | |
| 64 |
| User | Count |
|---|---|
| 114 | |
| 97 | |
| 95 | |
| 68 | |
| 65 |


