- Power BI forums
- Updates
- News & Announcements
- Get Help with Power BI
- Desktop
- Service
- Report Server
- Power Query
- Mobile Apps
- Developer
- DAX Commands and Tips
- Custom Visuals Development Discussion
- Health and Life Sciences
- Power BI Spanish forums
- Translated Spanish Desktop
- Power Platform Integration - Better Together!
- Power Platform Integrations (Read-only)
- Power Platform and Dynamics 365 Integrations (Read-only)
- Training and Consulting
- Instructor Led Training
- Dashboard in a Day for Women, by Women
- Galleries
- Community Connections & How-To Videos
- COVID-19 Data Stories Gallery
- Themes Gallery
- Data Stories Gallery
- R Script Showcase
- Webinars and Video Gallery
- Quick Measures Gallery
- 2021 MSBizAppsSummit Gallery
- 2020 MSBizAppsSummit Gallery
- 2019 MSBizAppsSummit Gallery
- Events
- Ideas
- Custom Visuals Ideas
- Issues
- Issues
- Events
- Upcoming Events
- Community Blog
- Power BI Community Blog
- Custom Visuals Community Blog
- Community Support
- Community Accounts & Registration
- Using the Community
- Community Feedback
Register now to learn Fabric in free live sessions led by the best Microsoft experts. From Apr 16 to May 9, in English and Spanish.
- Power BI forums
- Forums
- Get Help with Power BI
- Desktop
- Selectcolumns to make new table and how to sort it
- Subscribe to RSS Feed
- Mark Topic as New
- Mark Topic as Read
- Float this Topic for Current User
- Bookmark
- Subscribe
- Printer Friendly Page
- Mark as New
- Bookmark
- Subscribe
- Mute
- Subscribe to RSS Feed
- Permalink
- Report Inappropriate Content
Selectcolumns to make new table and how to sort it
So from an existing table I was able to extract this :
The goal is to see by day how many time a person (name) spend on a process.
So for that I want to make a calculated column but then first I need to sort these 4 columns so
that per day, per name and per time I can see which process was worked on.
Because as you now see it it is not correct.
This is what the first name did on Feb 1st:
And also as you see here the sorting is not correct as time is all over the place.
Is there a way I can sort this new table?
So by date, then by name and then by time.
Solved! Go to Solution.
- Mark as New
- Bookmark
- Subscribe
- Mute
- Subscribe to RSS Feed
- Permalink
- Report Inappropriate Content
output
Column =

var currenttime =  'Table'[Time]
var prev_time =
SELECTCOLUMNS(
OFFSET(
    -1,
    SUMMARIZE(
        'Table',
        'Table'[Date],
        'Table'[name],
        'Table'[Time]
    ),
    ORDERBY( 'Table'[Date] ,asc, 'Table'[Time] , asc),
    PARTITIONBY('Table'[Name],'Table'[Date])
),"time",'Table'[Time]
)

return  DATEDIFF(prev_time,currenttime,MINUTE)
Column 3 =
 SELECTCOLUMNS(
OFFSET(
    1,
     SUMMARIZE(
        'Table',
        'Table'[Name],
         'Table'[Date],
          'Table'[Time]
          ,'Table'[Column]
        ),
        ORDERBY( 'Table'[Date] ,asc, 'Table'[Time] , asc),
    PARTITIONBY('Table'[Name],'Table'[Date])
    ),"time",'Table'[Column]
)
then use in the visual, column3
hope this helps .
If my answer helped sort things out for you, i would appreciate a thumbs up 👍 and mark it as the solution ✅
It makes a difference and might help someone else too. Thanks for spreading the good vibes! 🤠
- Mark as New
- Bookmark
- Subscribe
- Mute
- Subscribe to RSS Feed
- Permalink
- Report Inappropriate Content
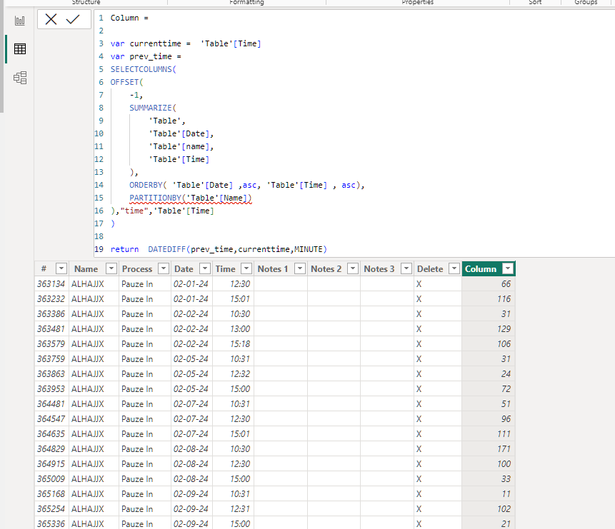
Thanks @Daniel29195 this looks very impressive.
Although the partitionby seems to have an error but there is still output.
Put it now on my main table as there was no use for a new table.
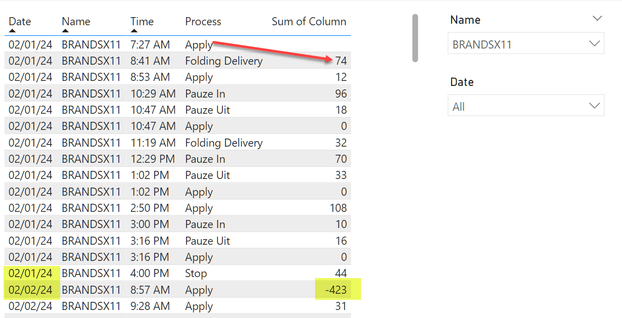
Still these values are not entirely correct I guess:
I think the process Apply should show 74 minutes and the Folding Delivery 12 minutes etc.
And also the change in the day causes some problems.
Should 'reset' at a day level when calculating.
- Mark as New
- Bookmark
- Subscribe
- Mute
- Subscribe to RSS Feed
- Permalink
- Report Inappropriate Content
output
Column =

var currenttime =  'Table'[Time]
var prev_time =
SELECTCOLUMNS(
OFFSET(
    -1,
    SUMMARIZE(
        'Table',
        'Table'[Date],
        'Table'[name],
        'Table'[Time]
    ),
    ORDERBY( 'Table'[Date] ,asc, 'Table'[Time] , asc),
    PARTITIONBY('Table'[Name],'Table'[Date])
),"time",'Table'[Time]
)

return  DATEDIFF(prev_time,currenttime,MINUTE)
Column 3 =
 SELECTCOLUMNS(
OFFSET(
    1,
     SUMMARIZE(
        'Table',
        'Table'[Name],
         'Table'[Date],
          'Table'[Time]
          ,'Table'[Column]
        ),
        ORDERBY( 'Table'[Date] ,asc, 'Table'[Time] , asc),
    PARTITIONBY('Table'[Name],'Table'[Date])
    ),"time",'Table'[Column]
)
then use in the visual, column3
hope this helps .
If my answer helped sort things out for you, i would appreciate a thumbs up 👍 and mark it as the solution ✅
It makes a difference and might help someone else too. Thanks for spreading the good vibes! 🤠
- Mark as New
- Bookmark
- Subscribe
- Mute
- Subscribe to RSS Feed
- Permalink
- Report Inappropriate Content
@Daniel29195 thanks!
Unfortunately I get this on the first column:
Is it an exact copy as you have made in the pbix I sent?
- Mark as New
- Bookmark
- Subscribe
- Mute
- Subscribe to RSS Feed
- Permalink
- Report Inappropriate Content
@rpinxt it seems from the image, you ddidnt put the name of the column you are creating ,
you are starting your code with var =
- Mark as New
- Bookmark
- Subscribe
- Mute
- Subscribe to RSS Feed
- Permalink
- Report Inappropriate Content
@rpinxt is it possible to share the pbix file to take a look at what is happening from your side ?
- Mark as New
- Bookmark
- Subscribe
- Mute
- Subscribe to RSS Feed
- Permalink
- Report Inappropriate Content
🤦
You are right...sorry about that!
Looks indeed to be working.
Thanks a lot!!
- Mark as New
- Bookmark
- Subscribe
- Mute
- Subscribe to RSS Feed
- Permalink
- Report Inappropriate Content
Yes I uploaded the pbix file here:
https://drive.google.com/file/d/1nV-2HYrQPcUIDiaO8XbZbz--3zHY7qzE/view?usp=drivesdk
Let me know if you cannot access.
- Mark as New
- Bookmark
- Subscribe
- Mute
- Subscribe to RSS Feed
- Permalink
- Report Inappropriate Content
output
caclulated column added to the table :
Column =

var currenttime =  'Table'[Time]
var prev_time =
SELECTCOLUMNS(
OFFSET(
    -1,
    SUMMARIZE(
        'Table',
        'Table'[DateName],
        'Table'[name],
        'Table'[Time]
    ),
    ORDERBY( 'Table'[DateName] ,asc, 'Table'[Time] , asc),
    PARTITIONBY('Table'[name])
),"time",'Table'[Time]
)

return  DATEDIFF(prev_time,currenttime,MINUTE)
let me know if this helps .
If my answer helped sort things out for you, i would appreciate a thumbs up 👍 and mark it as the solution ✅
It makes a difference and might help someone else too. Thanks for spreading the good vibes! 🤠
Helpful resources

Microsoft Fabric Learn Together
Covering the world! 9:00-10:30 AM Sydney, 4:00-5:30 PM CET (Paris/Berlin), 7:00-8:30 PM Mexico City

Power BI Monthly Update - April 2024
Check out the April 2024 Power BI update to learn about new features.

| User | Count |
|---|---|
| 106 | |
| 105 | |
| 79 | |
| 69 | |
| 62 |
| User | Count |
|---|---|
| 143 | |
| 104 | |
| 103 | |
| 82 | |
| 70 |


