- Power BI forums
- Updates
- News & Announcements
- Get Help with Power BI
- Desktop
- Service
- Report Server
- Power Query
- Mobile Apps
- Developer
- DAX Commands and Tips
- Custom Visuals Development Discussion
- Health and Life Sciences
- Power BI Spanish forums
- Translated Spanish Desktop
- Power Platform Integration - Better Together!
- Power Platform Integrations (Read-only)
- Power Platform and Dynamics 365 Integrations (Read-only)
- Training and Consulting
- Instructor Led Training
- Dashboard in a Day for Women, by Women
- Galleries
- Community Connections & How-To Videos
- COVID-19 Data Stories Gallery
- Themes Gallery
- Data Stories Gallery
- R Script Showcase
- Webinars and Video Gallery
- Quick Measures Gallery
- 2021 MSBizAppsSummit Gallery
- 2020 MSBizAppsSummit Gallery
- 2019 MSBizAppsSummit Gallery
- Events
- Ideas
- Custom Visuals Ideas
- Issues
- Issues
- Events
- Upcoming Events
- Community Blog
- Power BI Community Blog
- Custom Visuals Community Blog
- Community Support
- Community Accounts & Registration
- Using the Community
- Community Feedback
Register now to learn Fabric in free live sessions led by the best Microsoft experts. From Apr 16 to May 9, in English and Spanish.
- Power BI forums
- Forums
- Get Help with Power BI
- Desktop
- Cumulative frequency percentage over two or more T...
- Subscribe to RSS Feed
- Mark Topic as New
- Mark Topic as Read
- Float this Topic for Current User
- Bookmark
- Subscribe
- Printer Friendly Page
- Mark as New
- Bookmark
- Subscribe
- Mute
- Subscribe to RSS Feed
- Permalink
- Report Inappropriate Content
Cumulative frequency percentage over two or more Tables in Power BI
I've been trying to find the right way to explain the issue that I'm having:
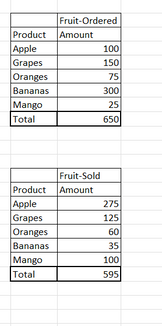
I have 2 Tables- "Fruit-Ordered" & "Fruit-Sold"
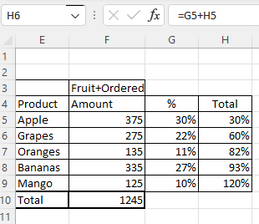
I've created a measure that puts both tables together in power bi
example:
In the "Total" Columns I've create "Cumulative Frequency Percentage" from excel.
Now I want to create a measure of "Cumulative Frequency Percentage" in Power BI, between the two tables I have.
Is this possible to create a measure from the TWO tables
or
Do I need to create a "custom" table between the two.
I really hope I find the right answer for this, and thanks to anyone for the help
Solved! Go to Solution.
- Mark as New
- Bookmark
- Subscribe
- Mute
- Subscribe to RSS Feed
- Permalink
- Report Inappropriate Content
if you want to not join the tables into one you will need to create a table of unique values of the product between the tables and then join the product (or fruit) in each transactional table to this middle table. then you can have a join between the tables and easily aggregate both values against the product. If you have a dates you will need to do the same with adding a date table in the middle of the 2 transactional tables.
If I took the time to answer your question and I came up with a solution, please mark my post as a solution and /or give kudos freely for the effort 🙂 Thank you!
Proud to be a Super User!
- Mark as New
- Bookmark
- Subscribe
- Mute
- Subscribe to RSS Feed
- Permalink
- Report Inappropriate Content
Thank you for responding to this!
It seems like a long process to do it this way but I totally understand
- Mark as New
- Bookmark
- Subscribe
- Mute
- Subscribe to RSS Feed
- Permalink
- Report Inappropriate Content
yep correct, modelling your data correctly while it may take a bit longer to set up (although there are ways and means to speeding this up) will make your life far easier in the long terrm however it just depends on what you need the model for. For a quick answer to a model that is only required for adhoc analysis then just do a merge table in power query using a full outer join.
If I took the time to answer your question and I came up with a solution, please mark my post as a solution and /or give kudos freely for the effort 🙂 Thank you!
Proud to be a Super User!
- Mark as New
- Bookmark
- Subscribe
- Mute
- Subscribe to RSS Feed
- Permalink
- Report Inappropriate Content
The data I used in the example was just a mock of what data I'm actually using.
There alot of "extra" step when it comes to cleaning the data in power query.
Thank you for the help and understanding when it comes to dealing with this issue
Helpful resources

Microsoft Fabric Learn Together
Covering the world! 9:00-10:30 AM Sydney, 4:00-5:30 PM CET (Paris/Berlin), 7:00-8:30 PM Mexico City

Power BI Monthly Update - April 2024
Check out the April 2024 Power BI update to learn about new features.

| User | Count |
|---|---|
| 108 | |
| 105 | |
| 87 | |
| 74 | |
| 66 |
| User | Count |
|---|---|
| 124 | |
| 112 | |
| 96 | |
| 80 | |
| 72 |


