Go To
- Power BI forums
- Updates
- News & Announcements
- Get Help with Power BI
- Desktop
- Service
- Report Server
- Power Query
- Mobile Apps
- Developer
- DAX Commands and Tips
- Custom Visuals Development Discussion
- Health and Life Sciences
- Power BI Spanish forums
- Translated Spanish Desktop
- Power Platform Integration - Better Together!
- Power Platform Integrations (Read-only)
- Power Platform and Dynamics 365 Integrations (Read-only)
- Training and Consulting
- Instructor Led Training
- Dashboard in a Day for Women, by Women
- Galleries
- Community Connections & How-To Videos
- COVID-19 Data Stories Gallery
- Themes Gallery
- Data Stories Gallery
- R Script Showcase
- Webinars and Video Gallery
- Quick Measures Gallery
- 2021 MSBizAppsSummit Gallery
- 2020 MSBizAppsSummit Gallery
- 2019 MSBizAppsSummit Gallery
- Events
- Ideas
- Custom Visuals Ideas
- Issues
- Issues
- Events
- Upcoming Events
- Community Blog
- Power BI Community Blog
- Custom Visuals Community Blog
- Community Support
- Community Accounts & Registration
- Using the Community
- Community Feedback
Turn on suggestions
Auto-suggest helps you quickly narrow down your search results by suggesting possible matches as you type.
Showing results for
Earn a 50% discount on the DP-600 certification exam by completing the Fabric 30 Days to Learn It challenge.
- Power BI forums
- Galleries
- Data Stories Gallery
- Pokénation


- Mark as New
- Bookmark
- Subscribe
- Mute
- Subscribe to RSS Feed
- Permalink
- Report Inappropriate Content
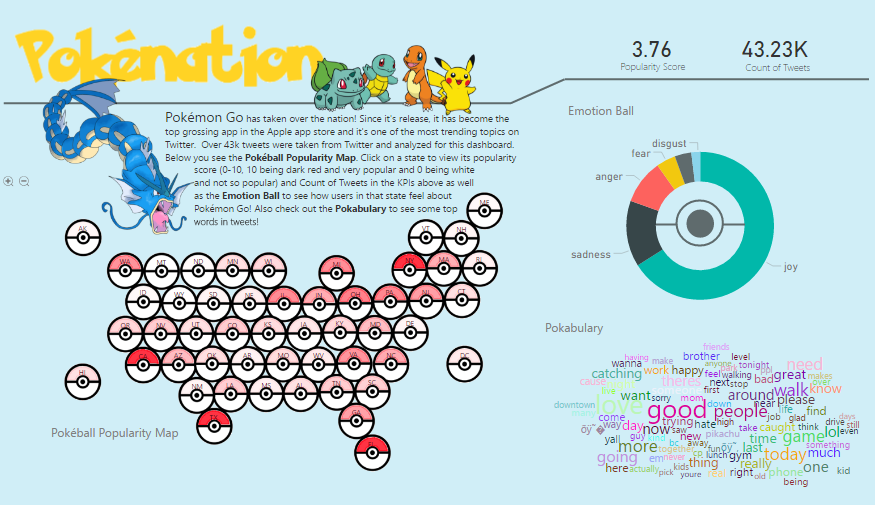
Pokénation
07-28-2016
03:05 PM
In this sentiment and emotional analysis of over 43,000 tweets about Pokémon Go, we are catching all the states' data using Power BI! Explore this interactive dashboard to see if Pennsylvania is crazy about Pikachu and what's making Mississippi mad! Using Power BI's custom visual 'Synoptic Panel' I have created a Pokéball US Map which displays the flexibility and endless possiblities with Power BI! Enjoy digging deep into this analysis of the Pokemon Go sensation and keep catching 'em all!
eyJrIjoiMTA2MGY0ZDMtMThhZi00NmVhLWI3N2UtODA4ODM0YzhhY2FkIiwidCI6ImQyOGMxMDVhLWI3N2ItNDA3Yy04YjBjLTFhNmYyZDNhZDg5MCIsImMiOjZ9