Jumpstart your career with the Fabric Career Hub
Find everything you need to get certified on Fabric—skills challenges, live sessions, exam prep, role guidance, and more.
Get started- Power BI forums
- Updates
- News & Announcements
- Get Help with Power BI
- Desktop
- Service
- Report Server
- Power Query
- Mobile Apps
- Developer
- DAX Commands and Tips
- Custom Visuals Development Discussion
- Health and Life Sciences
- Power BI Spanish forums
- Translated Spanish Desktop
- Power Platform Integration - Better Together!
- Power Platform Integrations (Read-only)
- Power Platform and Dynamics 365 Integrations (Read-only)
- Training and Consulting
- Instructor Led Training
- Dashboard in a Day for Women, by Women
- Galleries
- Community Connections & How-To Videos
- COVID-19 Data Stories Gallery
- Themes Gallery
- Data Stories Gallery
- R Script Showcase
- Webinars and Video Gallery
- Quick Measures Gallery
- 2021 MSBizAppsSummit Gallery
- 2020 MSBizAppsSummit Gallery
- 2019 MSBizAppsSummit Gallery
- Events
- Ideas
- Custom Visuals Ideas
- Issues
- Issues
- Events
- Upcoming Events
- Community Blog
- Power BI Community Blog
- Custom Visuals Community Blog
- Community Support
- Community Accounts & Registration
- Using the Community
- Community Feedback
Grow your Fabric skills and prepare for the DP-600 certification exam by completing the latest Microsoft Fabric challenge.
- Power BI forums
- Forums
- Get Help with Power BI
- DAX Commands and Tips
- Re: Cumulative Total with Dates Sliced by Separate...
- Subscribe to RSS Feed
- Mark Topic as New
- Mark Topic as Read
- Float this Topic for Current User
- Bookmark
- Subscribe
- Printer Friendly Page
- Mark as New
- Bookmark
- Subscribe
- Mute
- Subscribe to RSS Feed
- Permalink
- Report Inappropriate Content
Cumulative Total with Dates Sliced by Separate Table
Hi All,
I'm trying to build a dynamic cumulative totals measure, where the date dimension is able to be sliced by the data ranges from an iterations dimension. The measure the I'm working off of is the following, which lets me slice the dates to get the correct results:
CALCULATE (
    SUM ( FactTimeRegistrations[Hours] ),
    FILTER ( ALLSELECTED ( DimDate[Date] ) , DimDate[Date] <= MAX ( DimDate[Date] ) )
)
However, I want to add an additional filter to be able to slice the date based off of the date range from a given iteration, but I have been unsuccessful so far.
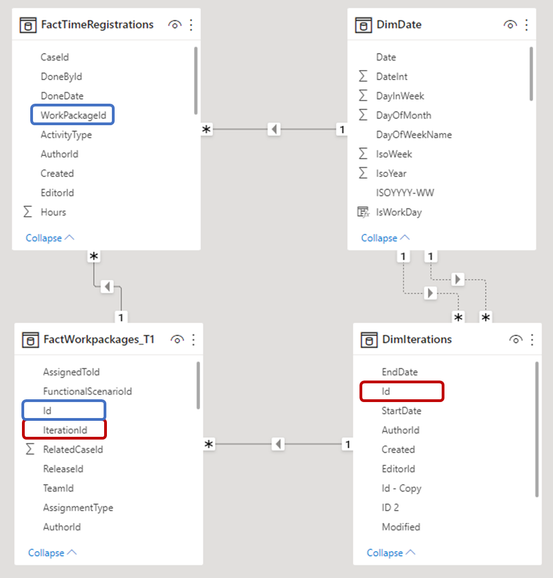
The three tables that the meassure would be using are these:
Any help would be greatly appreciated!
Solved! Go to Solution.
- Mark as New
- Bookmark
- Subscribe
- Mute
- Subscribe to RSS Feed
- Permalink
- Report Inappropriate Content
HI @MAVIE
Please try
Hours RT =
VAR T1 =
    FILTER ( ALLSELECTED ( DimDate[Date] ), DimDate[Date] <= MAX ( DimDate[Date] ) )
VAR StartDate =
    MAXX ( FactTimeRegistrations, RELATED ( DimIterations[StartDate] ) )
VAR EndDate =
    MAXX ( FactTimeRegistrations, RELATED ( DimIterations[EndDate] ) )
VAR T2 =
    CALENDAR ( StartDate, EndDate )
RETURN
CALCULATE ( SUM ( FactTimeRegistrations[Hours] ), INTERSECT ( T1, T2 ) )- Mark as New
- Bookmark
- Subscribe
- Mute
- Subscribe to RSS Feed
- Permalink
- Report Inappropriate Content
@MAVIE
First create realtionship as follows
Then use
Hours RT =
VAR T1 =
    FILTER ( ALLSELECTED ( DimDate[Date] ), DimDate[Date] <= MAX ( DimDate[Date] ) )
VAR T2 =
    CALENDAR (
        RELATED ( DimIterations[StartDate] ),
        RELATED ( DimIterations[EndDate] )
    )
RETURN
CALCULATE ( SUM ( FactTimeRegistrations[Hours] ), INTERSECT ( T1, T2 ) )- Mark as New
- Bookmark
- Subscribe
- Mute
- Subscribe to RSS Feed
- Permalink
- Report Inappropriate Content
Hi @tamerj1
I should have clarified the relationship. Iterations if connected to TimeRegistrations in this manner:
Also the chart that I'm creating looks as such, which has been sliced on the desired iteration. The issue then is that that have data point from before the iteration which should not be included in the calculation.
- Mark as New
- Bookmark
- Subscribe
- Mute
- Subscribe to RSS Feed
- Permalink
- Report Inappropriate Content
Hi @MAVIE
The same code above shall remain applicable. Please check and let me know which results you get. Thank you
- Mark as New
- Bookmark
- Subscribe
- Mute
- Subscribe to RSS Feed
- Permalink
- Report Inappropriate Content
Using that measure I get the following error
- Mark as New
- Bookmark
- Subscribe
- Mute
- Subscribe to RSS Feed
- Permalink
- Report Inappropriate Content
HI @MAVIE
Please try
Hours RT =
VAR T1 =
    FILTER ( ALLSELECTED ( DimDate[Date] ), DimDate[Date] <= MAX ( DimDate[Date] ) )
VAR StartDate =
    MAXX ( FactTimeRegistrations, RELATED ( DimIterations[StartDate] ) )
VAR EndDate =
    MAXX ( FactTimeRegistrations, RELATED ( DimIterations[EndDate] ) )
VAR T2 =
    CALENDAR ( StartDate, EndDate )
RETURN
CALCULATE ( SUM ( FactTimeRegistrations[Hours] ), INTERSECT ( T1, T2 ) )- Mark as New
- Bookmark
- Subscribe
- Mute
- Subscribe to RSS Feed
- Permalink
- Report Inappropriate Content
Hi @tamerj1
This measure seems to work as intended. If anything else goes wrong, I'll try to share some test data with you.
Thank you very much for your help!
- Mark as New
- Bookmark
- Subscribe
- Mute
- Subscribe to RSS Feed
- Permalink
- Report Inappropriate Content
- Mark as New
- Bookmark
- Subscribe
- Mute
- Subscribe to RSS Feed
- Permalink
- Report Inappropriate Content
Helpful resources
| User | Count |
|---|---|
| 52 | |
| 51 | |
| 20 | |
| 17 | |
| 16 |
| User | Count |
|---|---|
| 113 | |
| 46 | |
| 44 | |
| 28 | |
| 22 |


